contents
SOCIAL MEDIA
- Tide
- Pampers Amore
BRANDING
- Stone Circle Theatre
PRINT COLLATERAL
- Reese’s March Madness Activation
- Quest Protein
- Gain Scent Combos
DATA VISUALIZATION + INFOGRAPHICS
- DeVry Report
- P&G IR Report
- P&G Global FemCare Playbook
- HealthTrust 360 Report
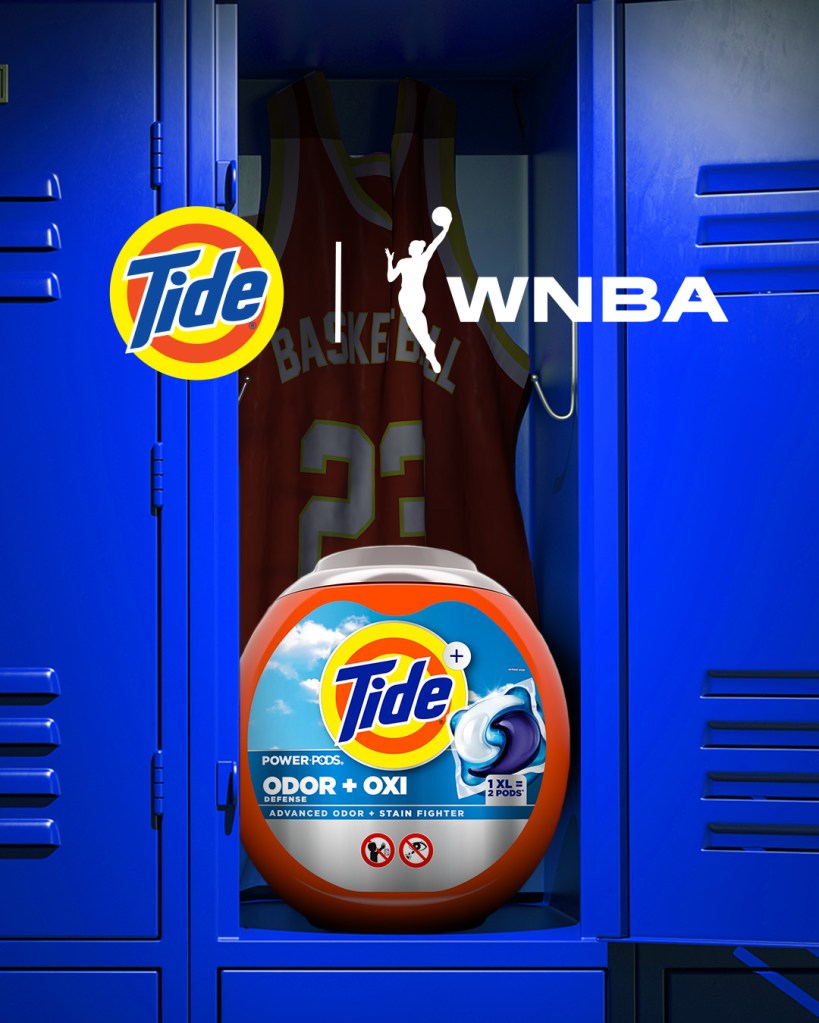
TIDE x WNBA
Instagram post to promote Tide’s continued sponsorship of the WNBA.
→ SOCIAL MEDIA


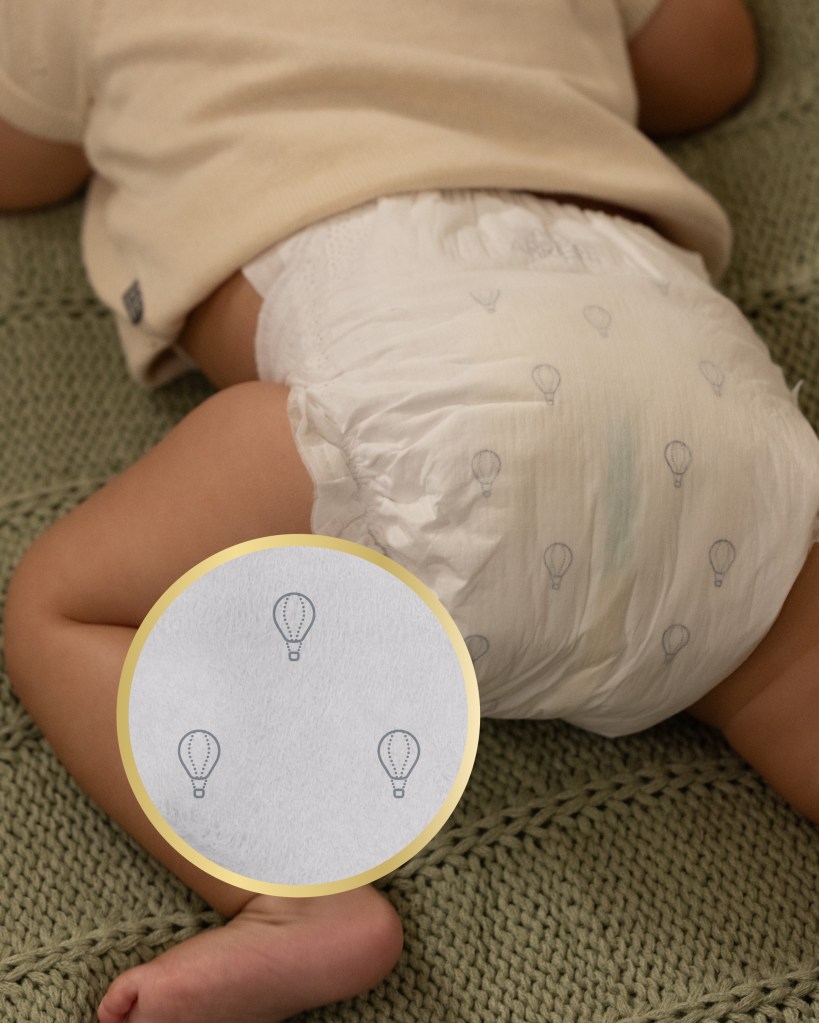
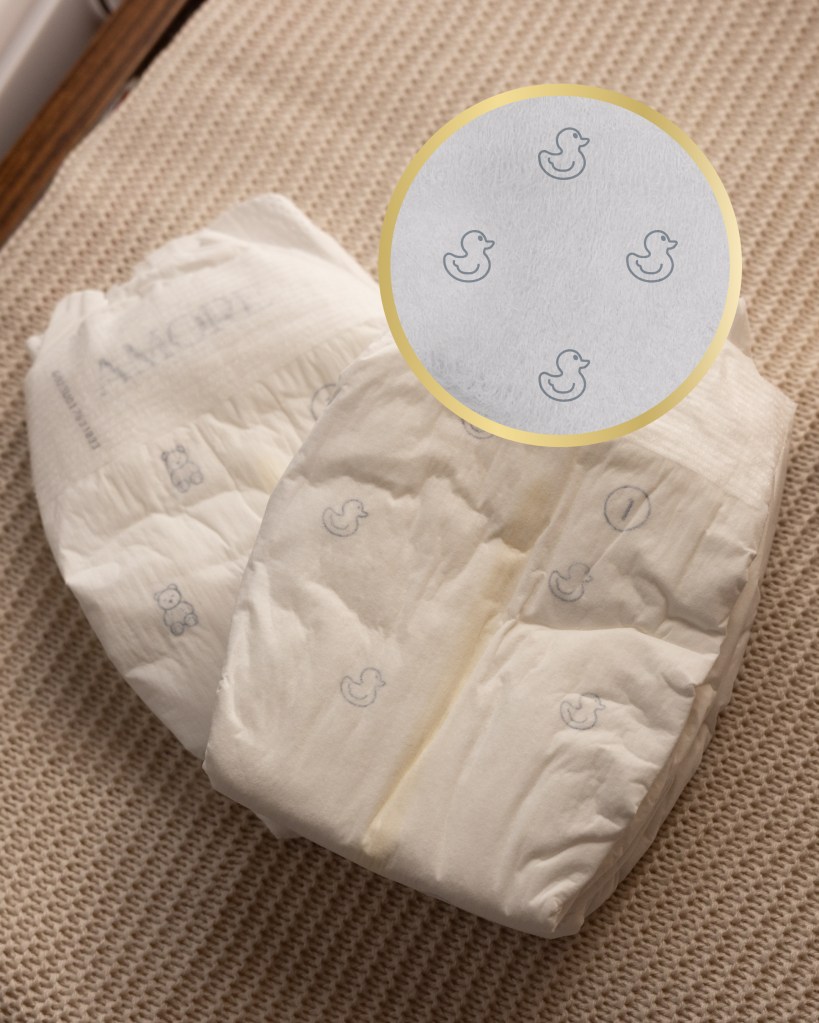
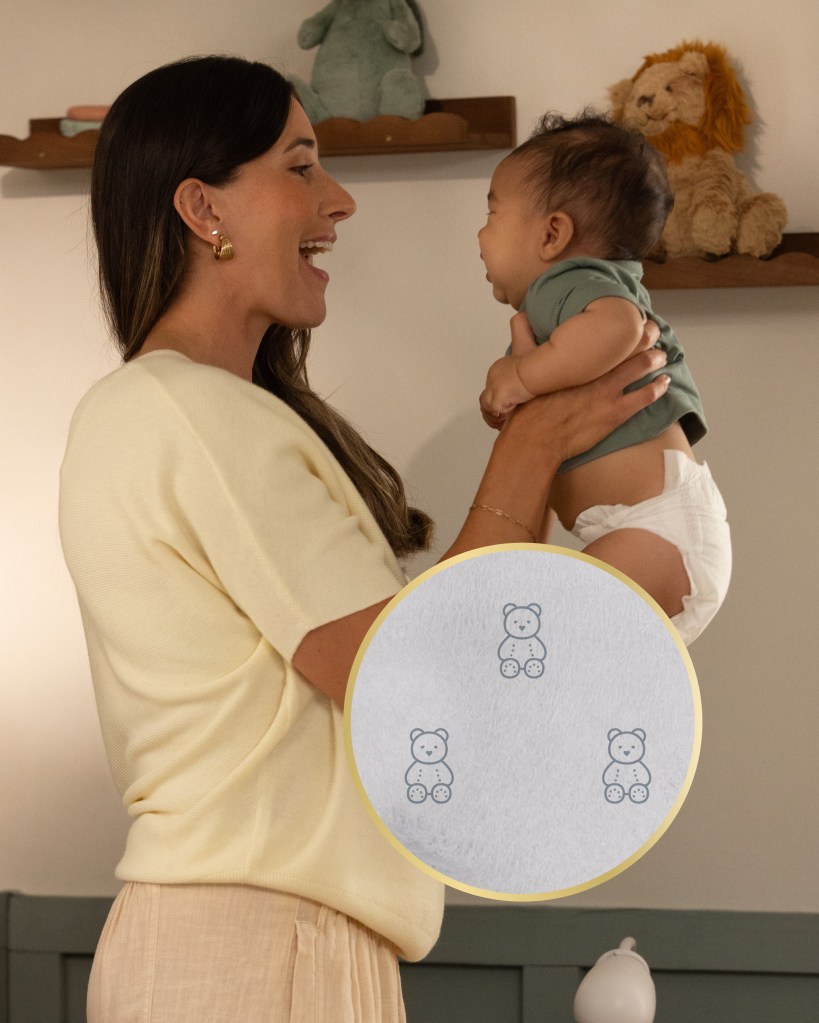
pampers amore
Instagram post to promote Pamper’s new premium diaper product, Amore.
→ SOCIAL MEDIA

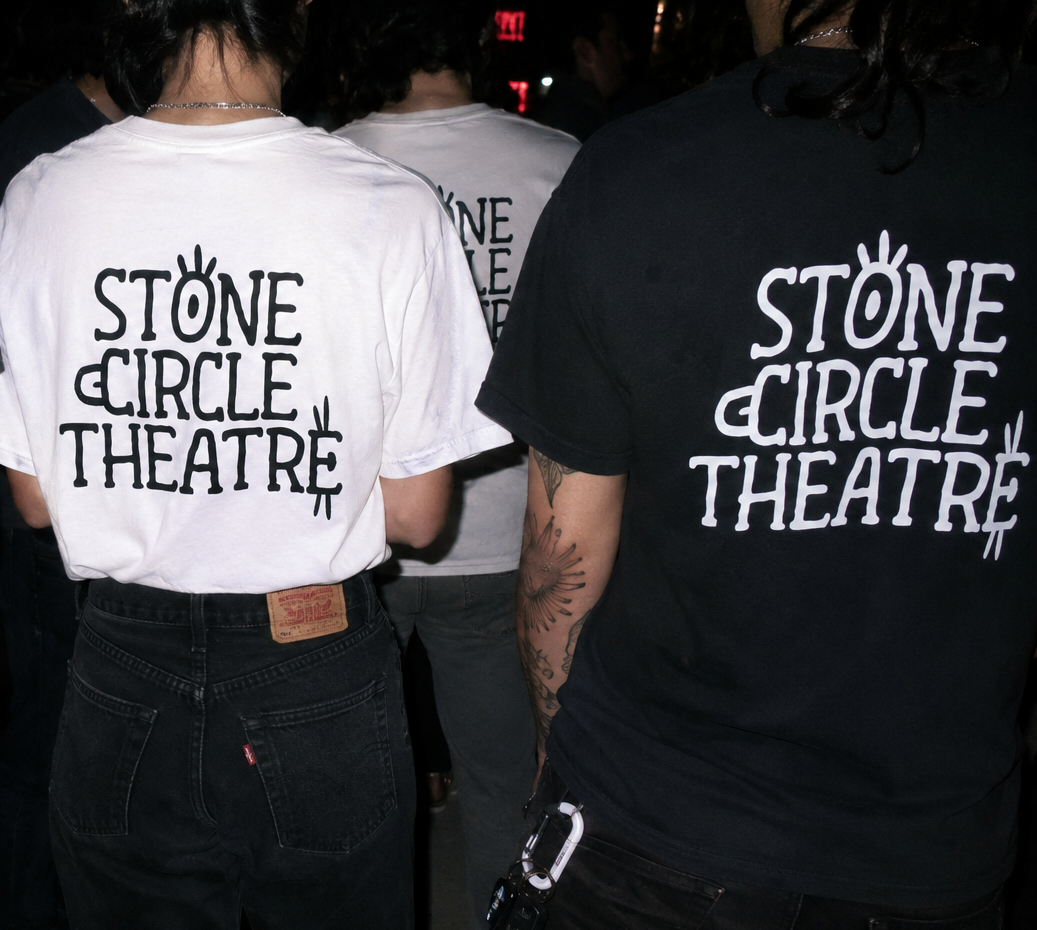
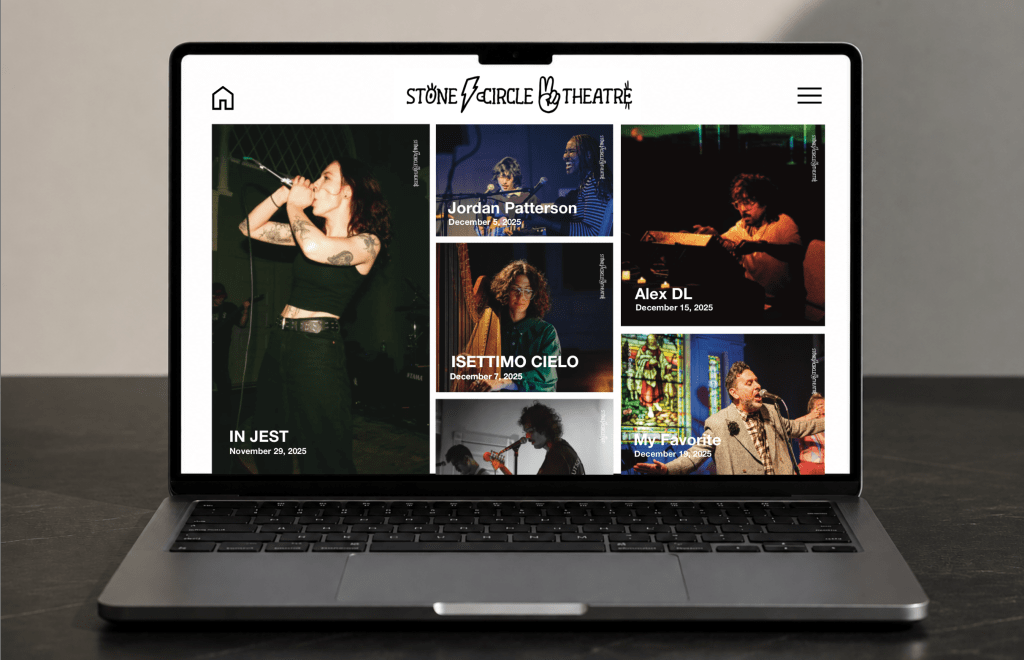
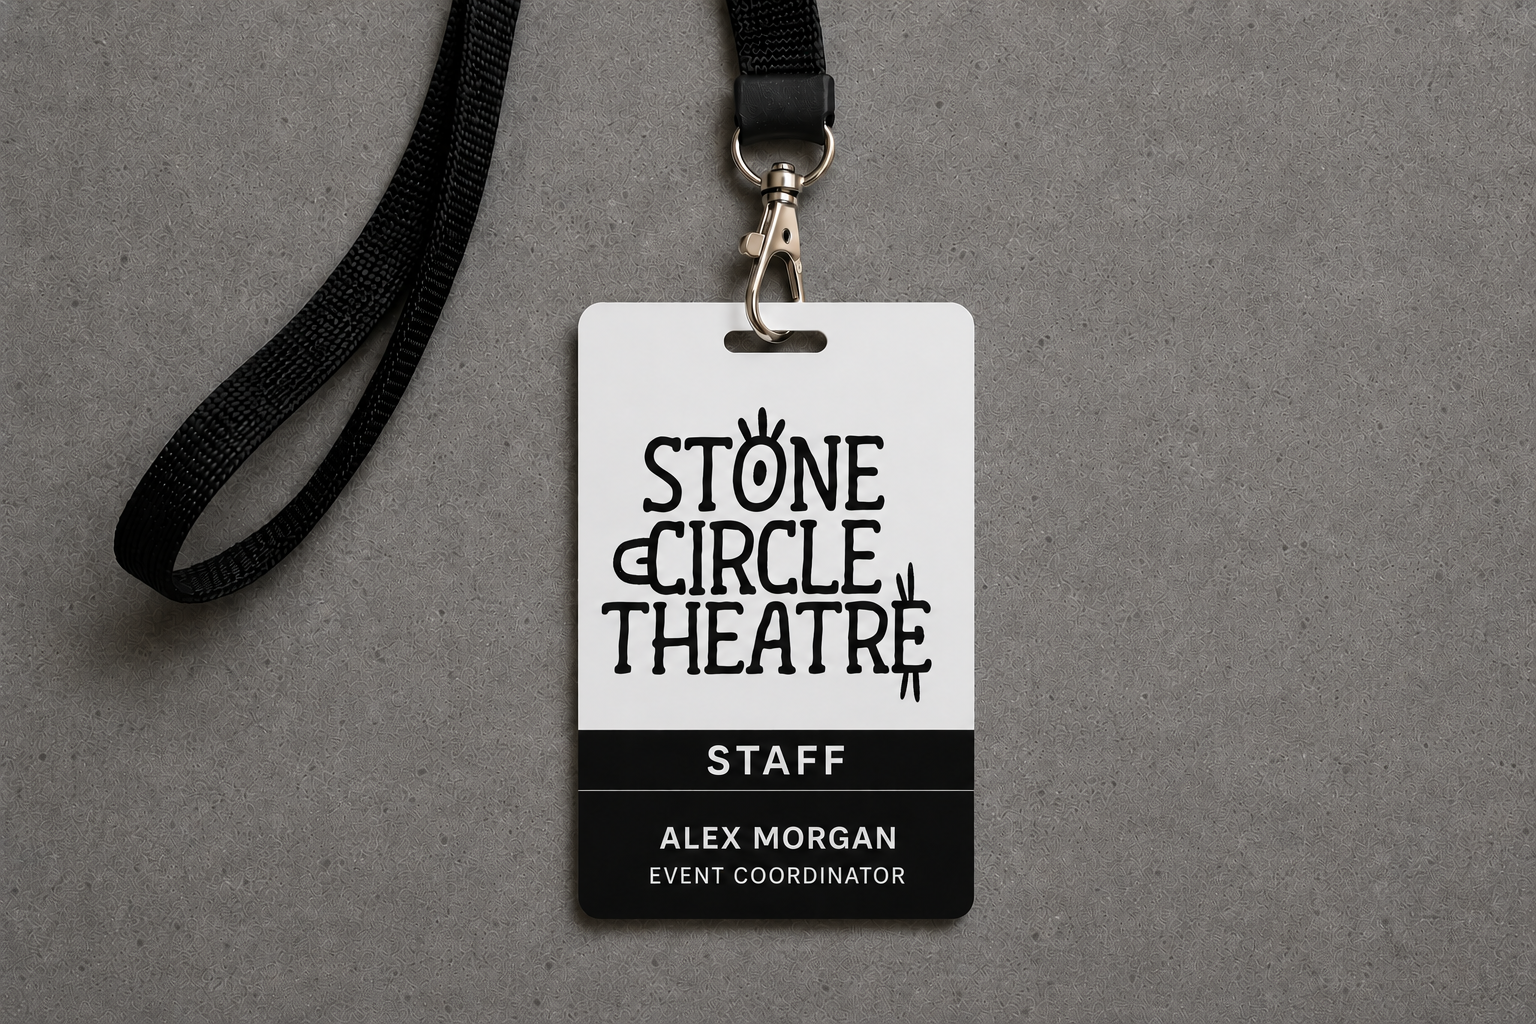
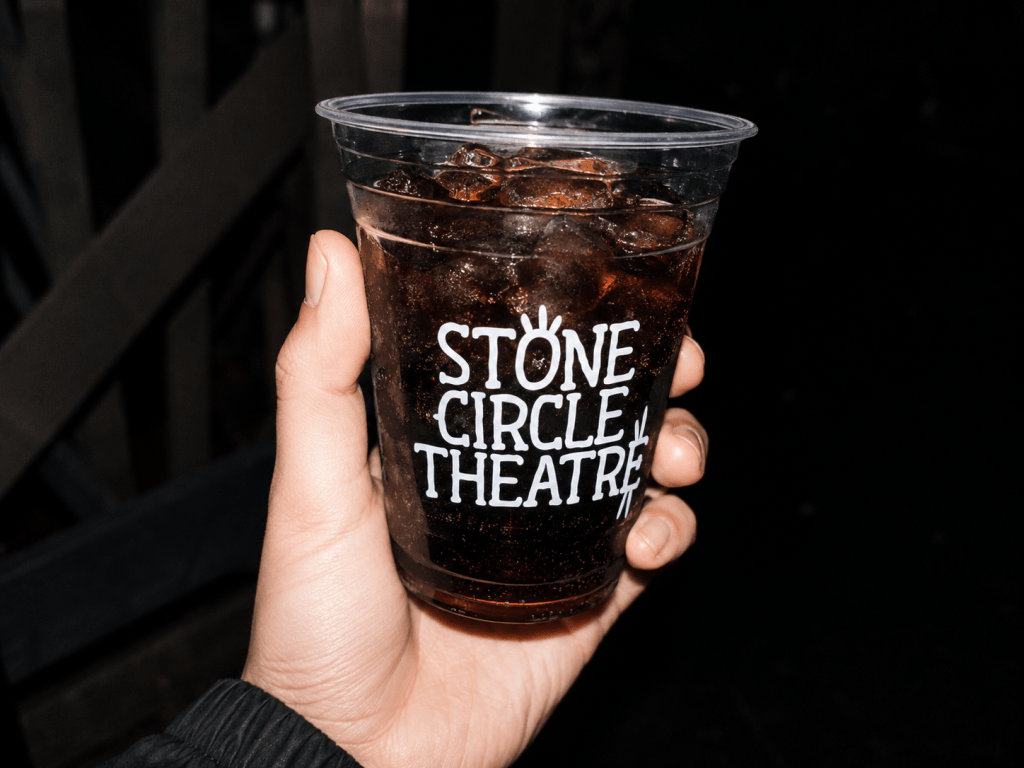
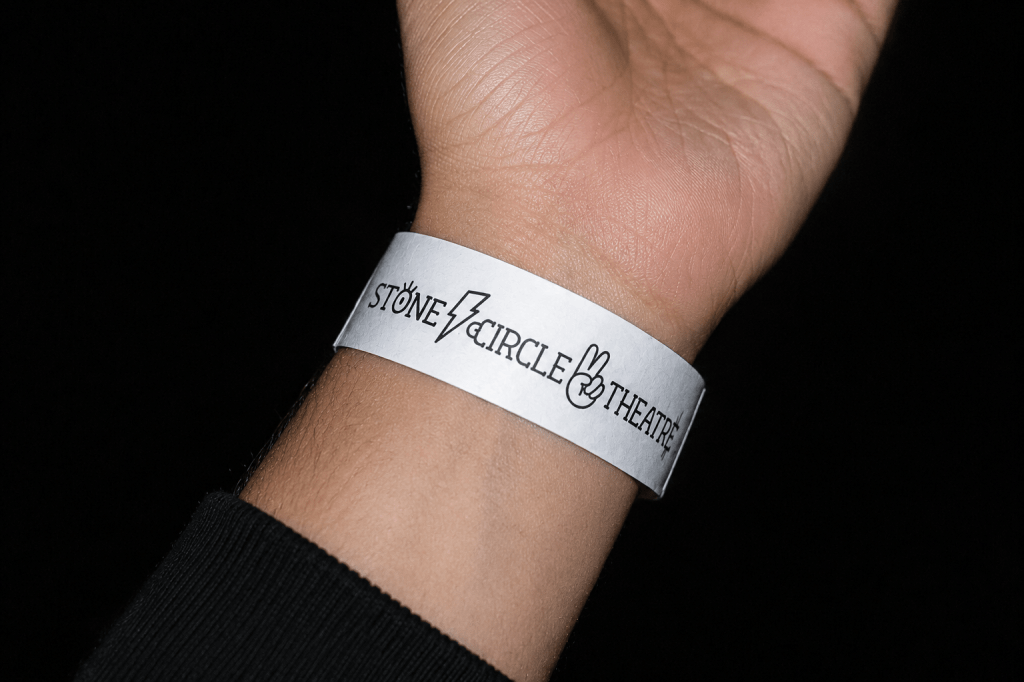
stone circle theatre IDENTITY SYSTEM
Rebrand exploration commissioned by Stone Circle Theatre. While the organization run out of a historic landmark church in Ridgewood, Queens, Stone Circle Theatre is an independent non-profit that space outside of service hours as a venue. From concerts to film festivals to nude figure drawing classes. It was non-negotiable that the client needed an identity that distinguished as unaffiliated with the church. This refresh explored a direction that was playful, versatile and as eccentric as the organization’s legacy.
→ BRANDing

REESE’S MARCH
MADNESS campAIGN
In order to earn buzz around March Madness, Reese’s invited a selected few WNBA personalities to talk their 2026 game predictions. The press event required a custom branded bracket (scalable for both display and print), name cards, backdrop and table cloth for the filmed interview. Capitalizing on Reese’s iconic color palette of bright orange and rich chocolate brown, the final result was a basketball-inspired theme that got players, press, fans, and influencers genuinely excited.
→ EVENT GRAPHICS

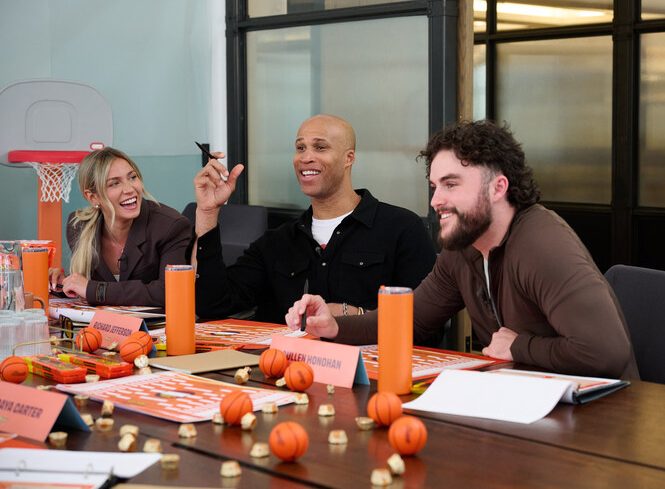
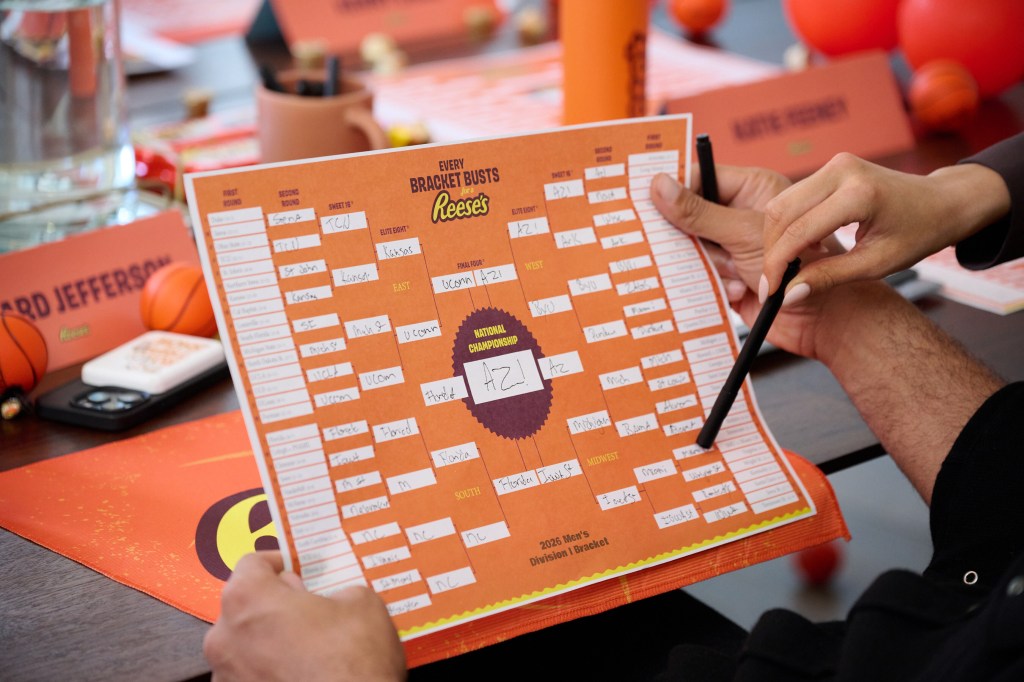
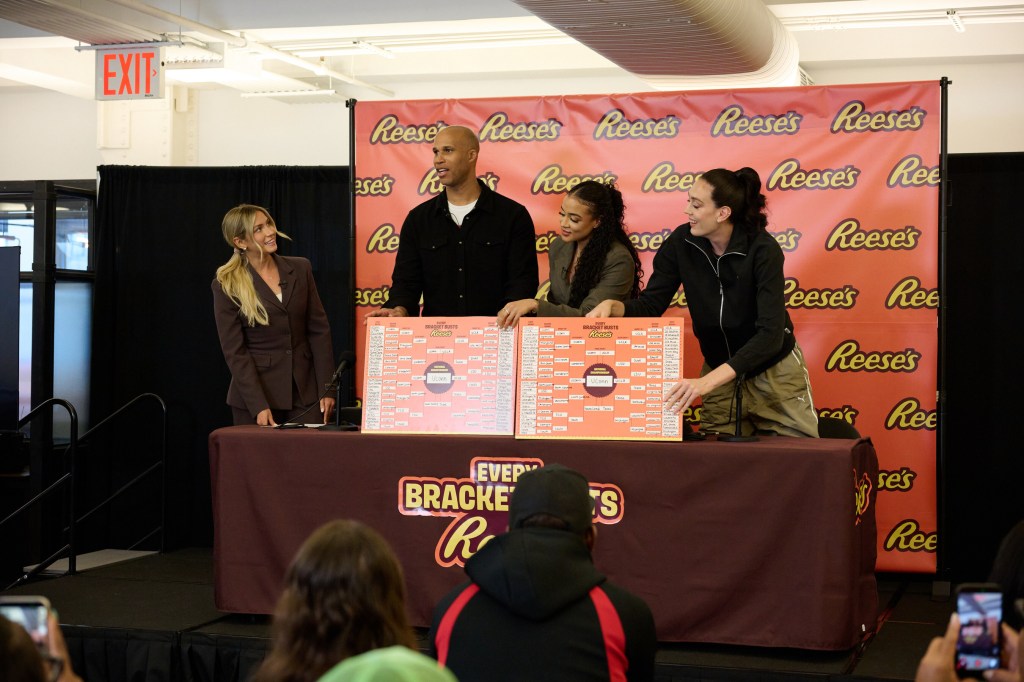
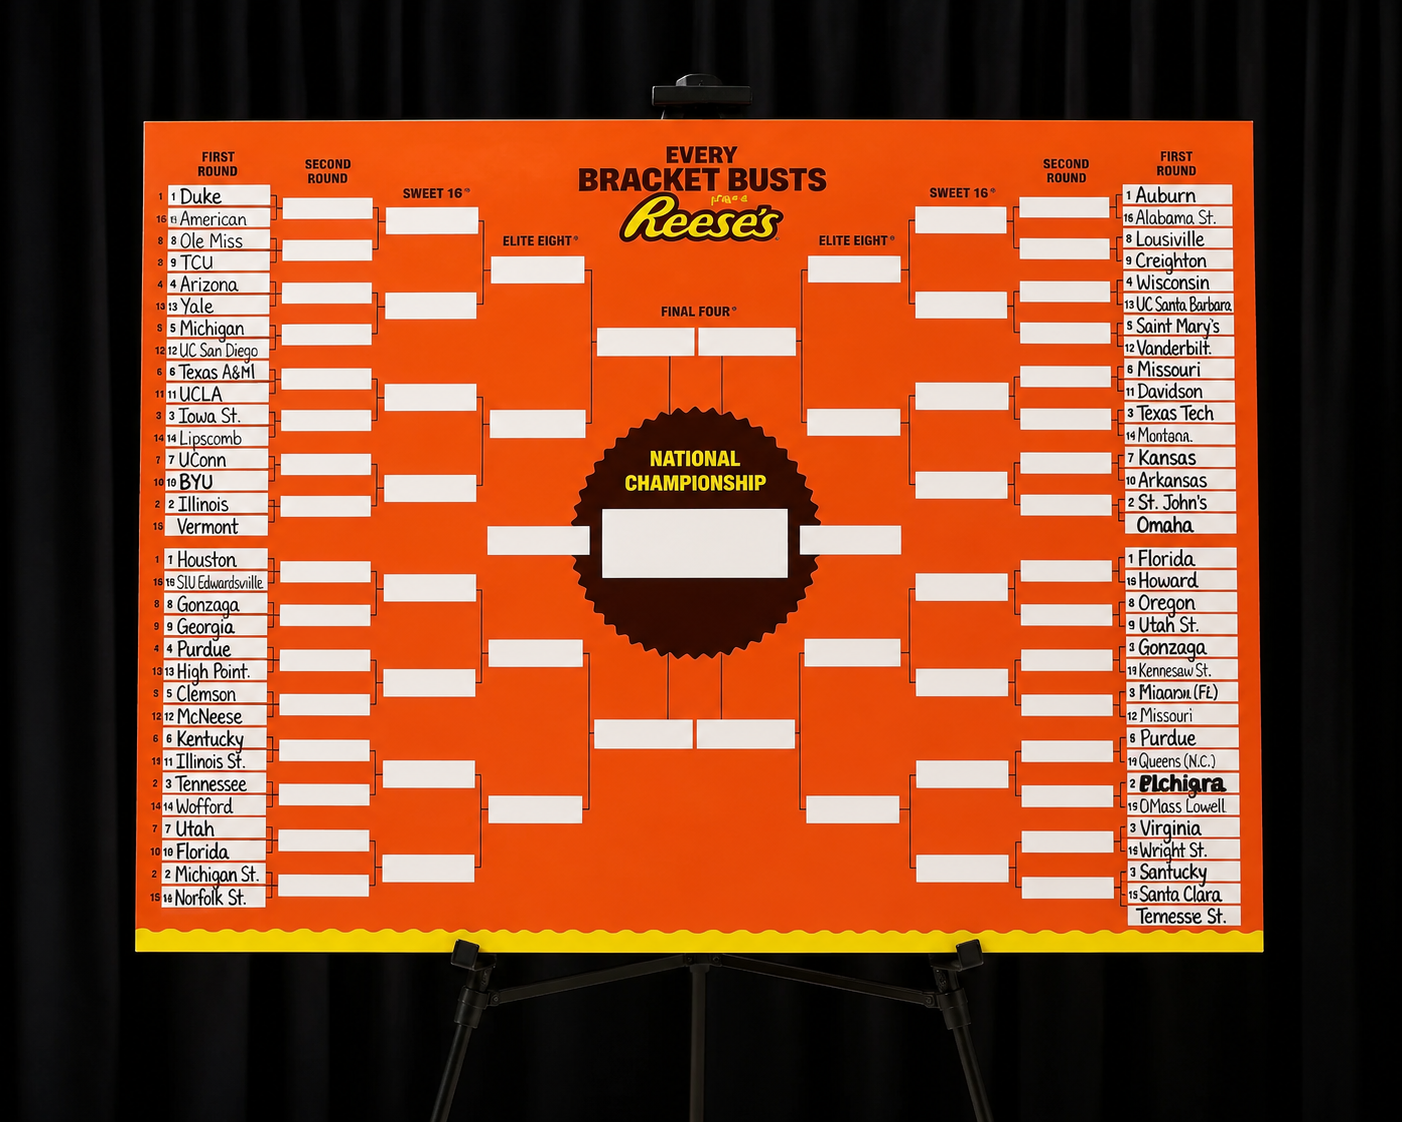

Reese’s Summit for “Every Bracket Busts for a Reese’s”
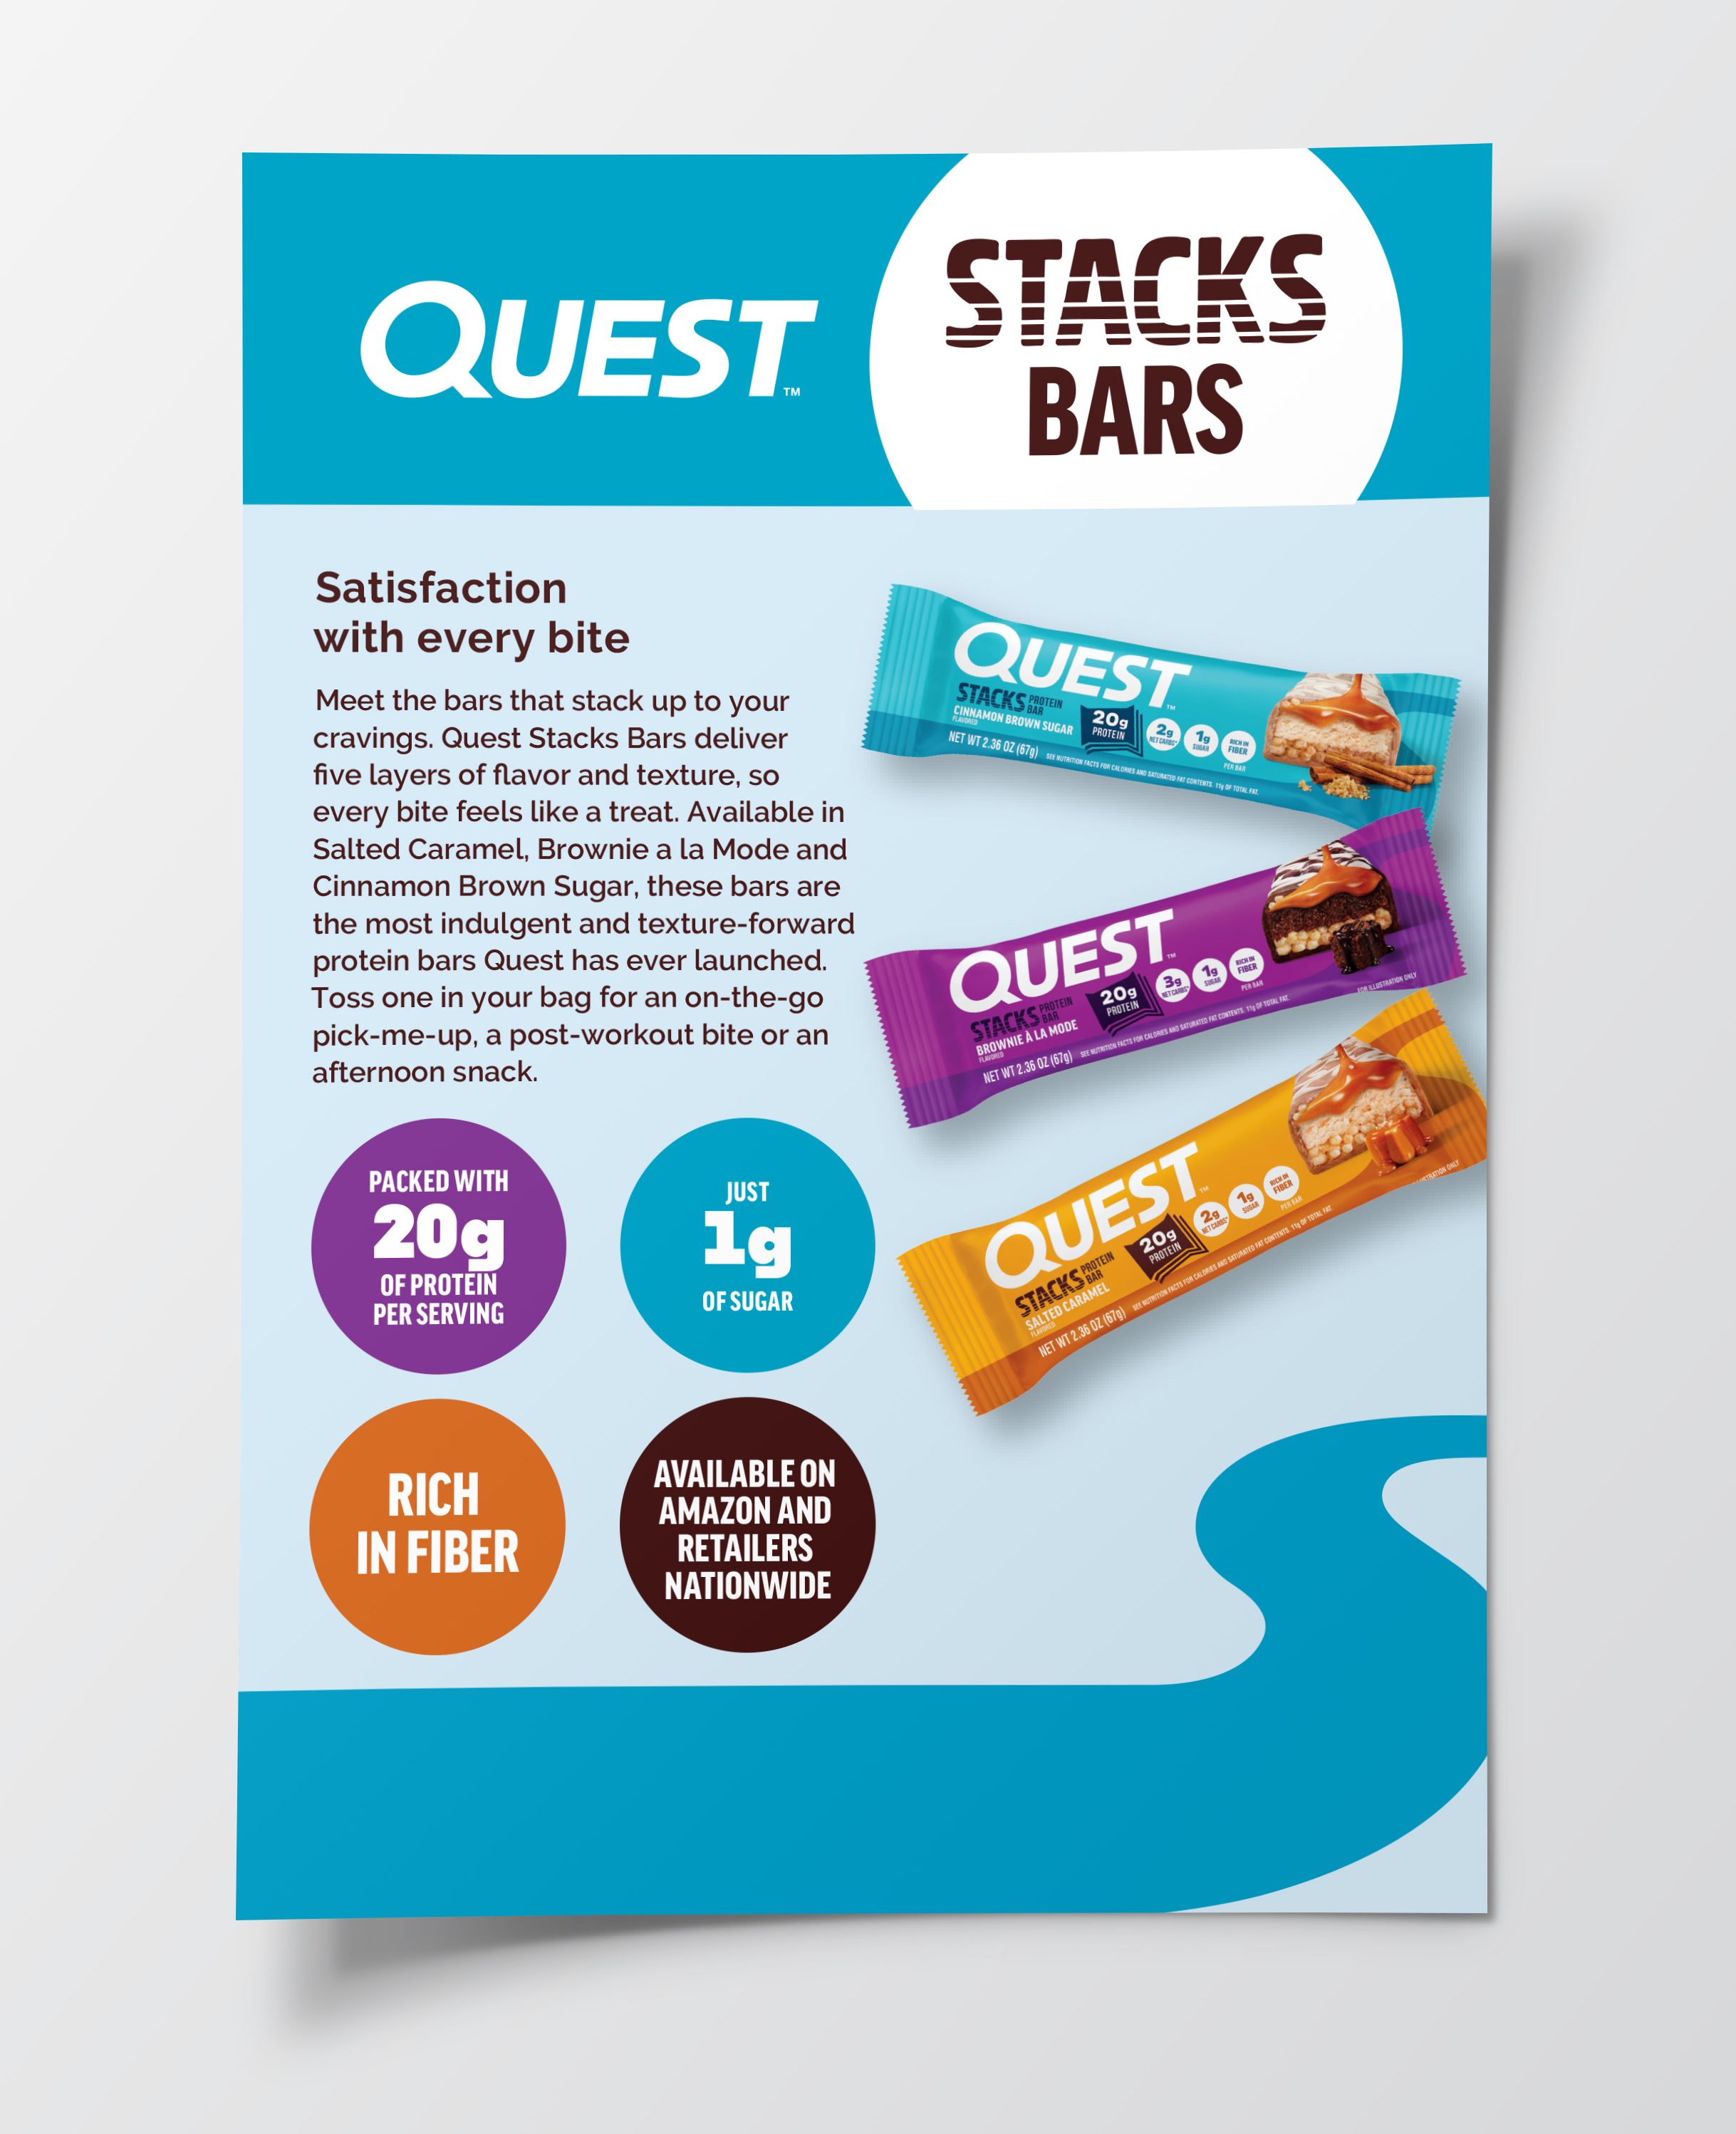
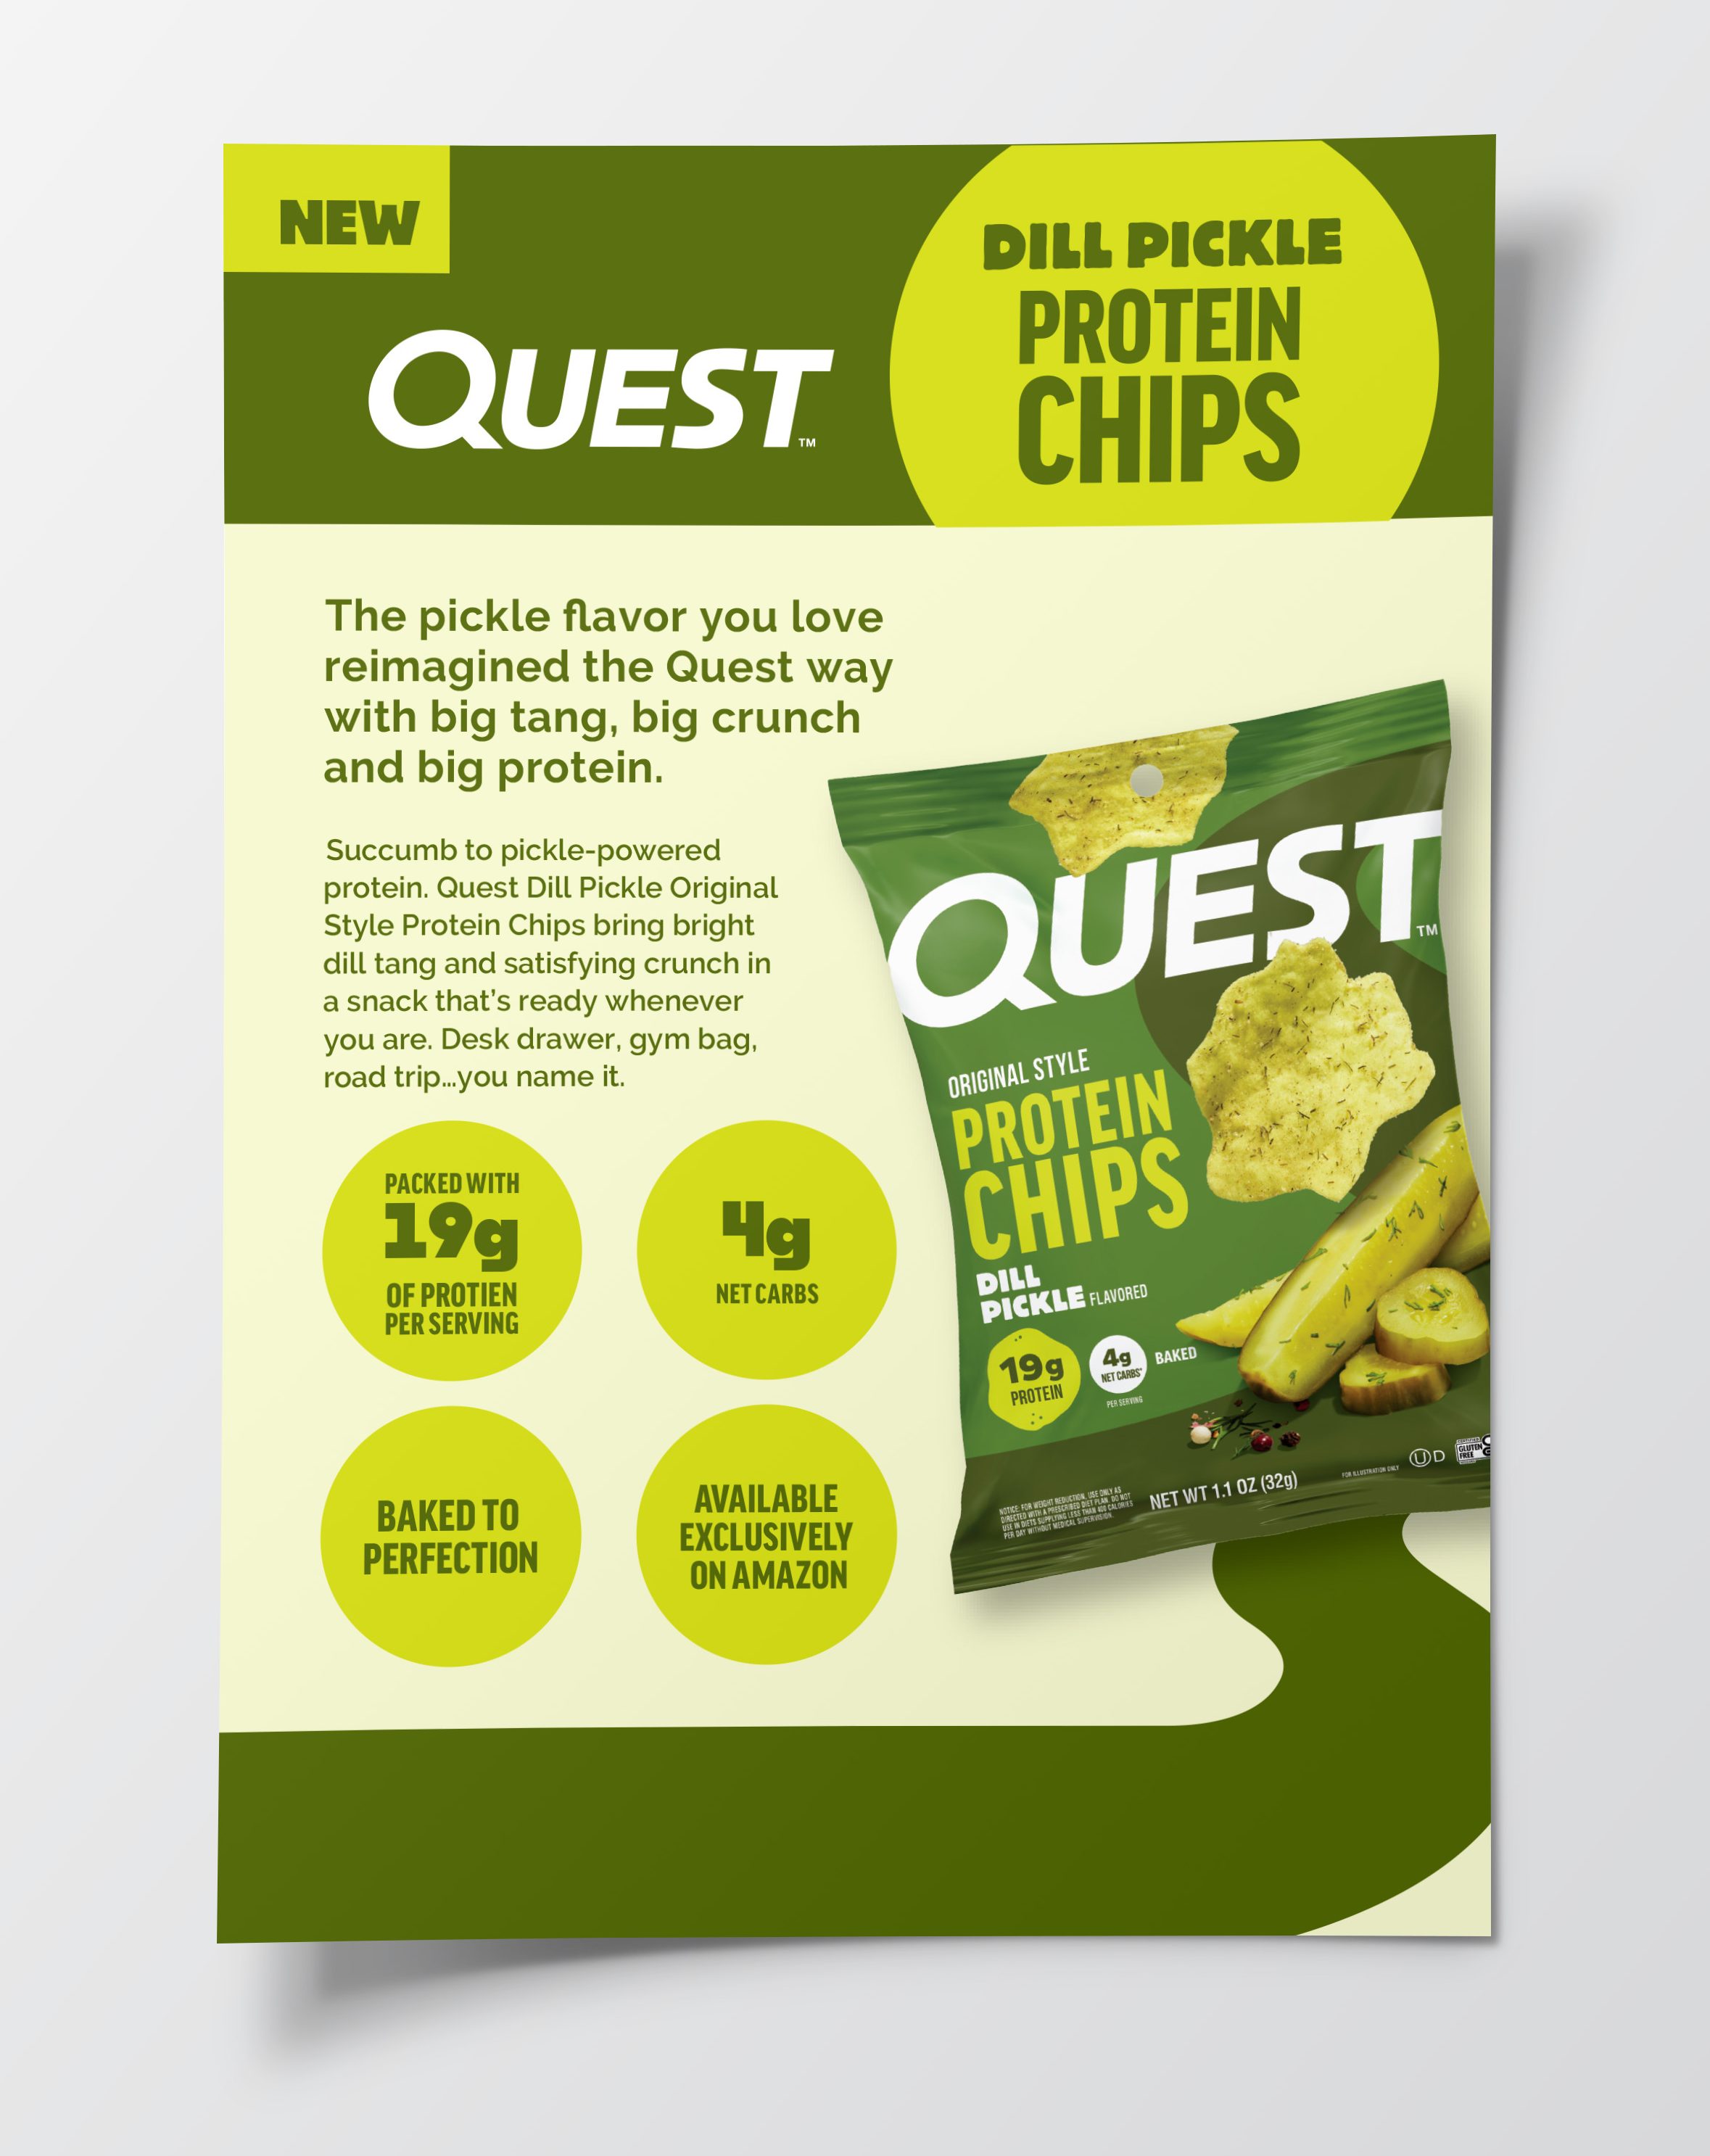
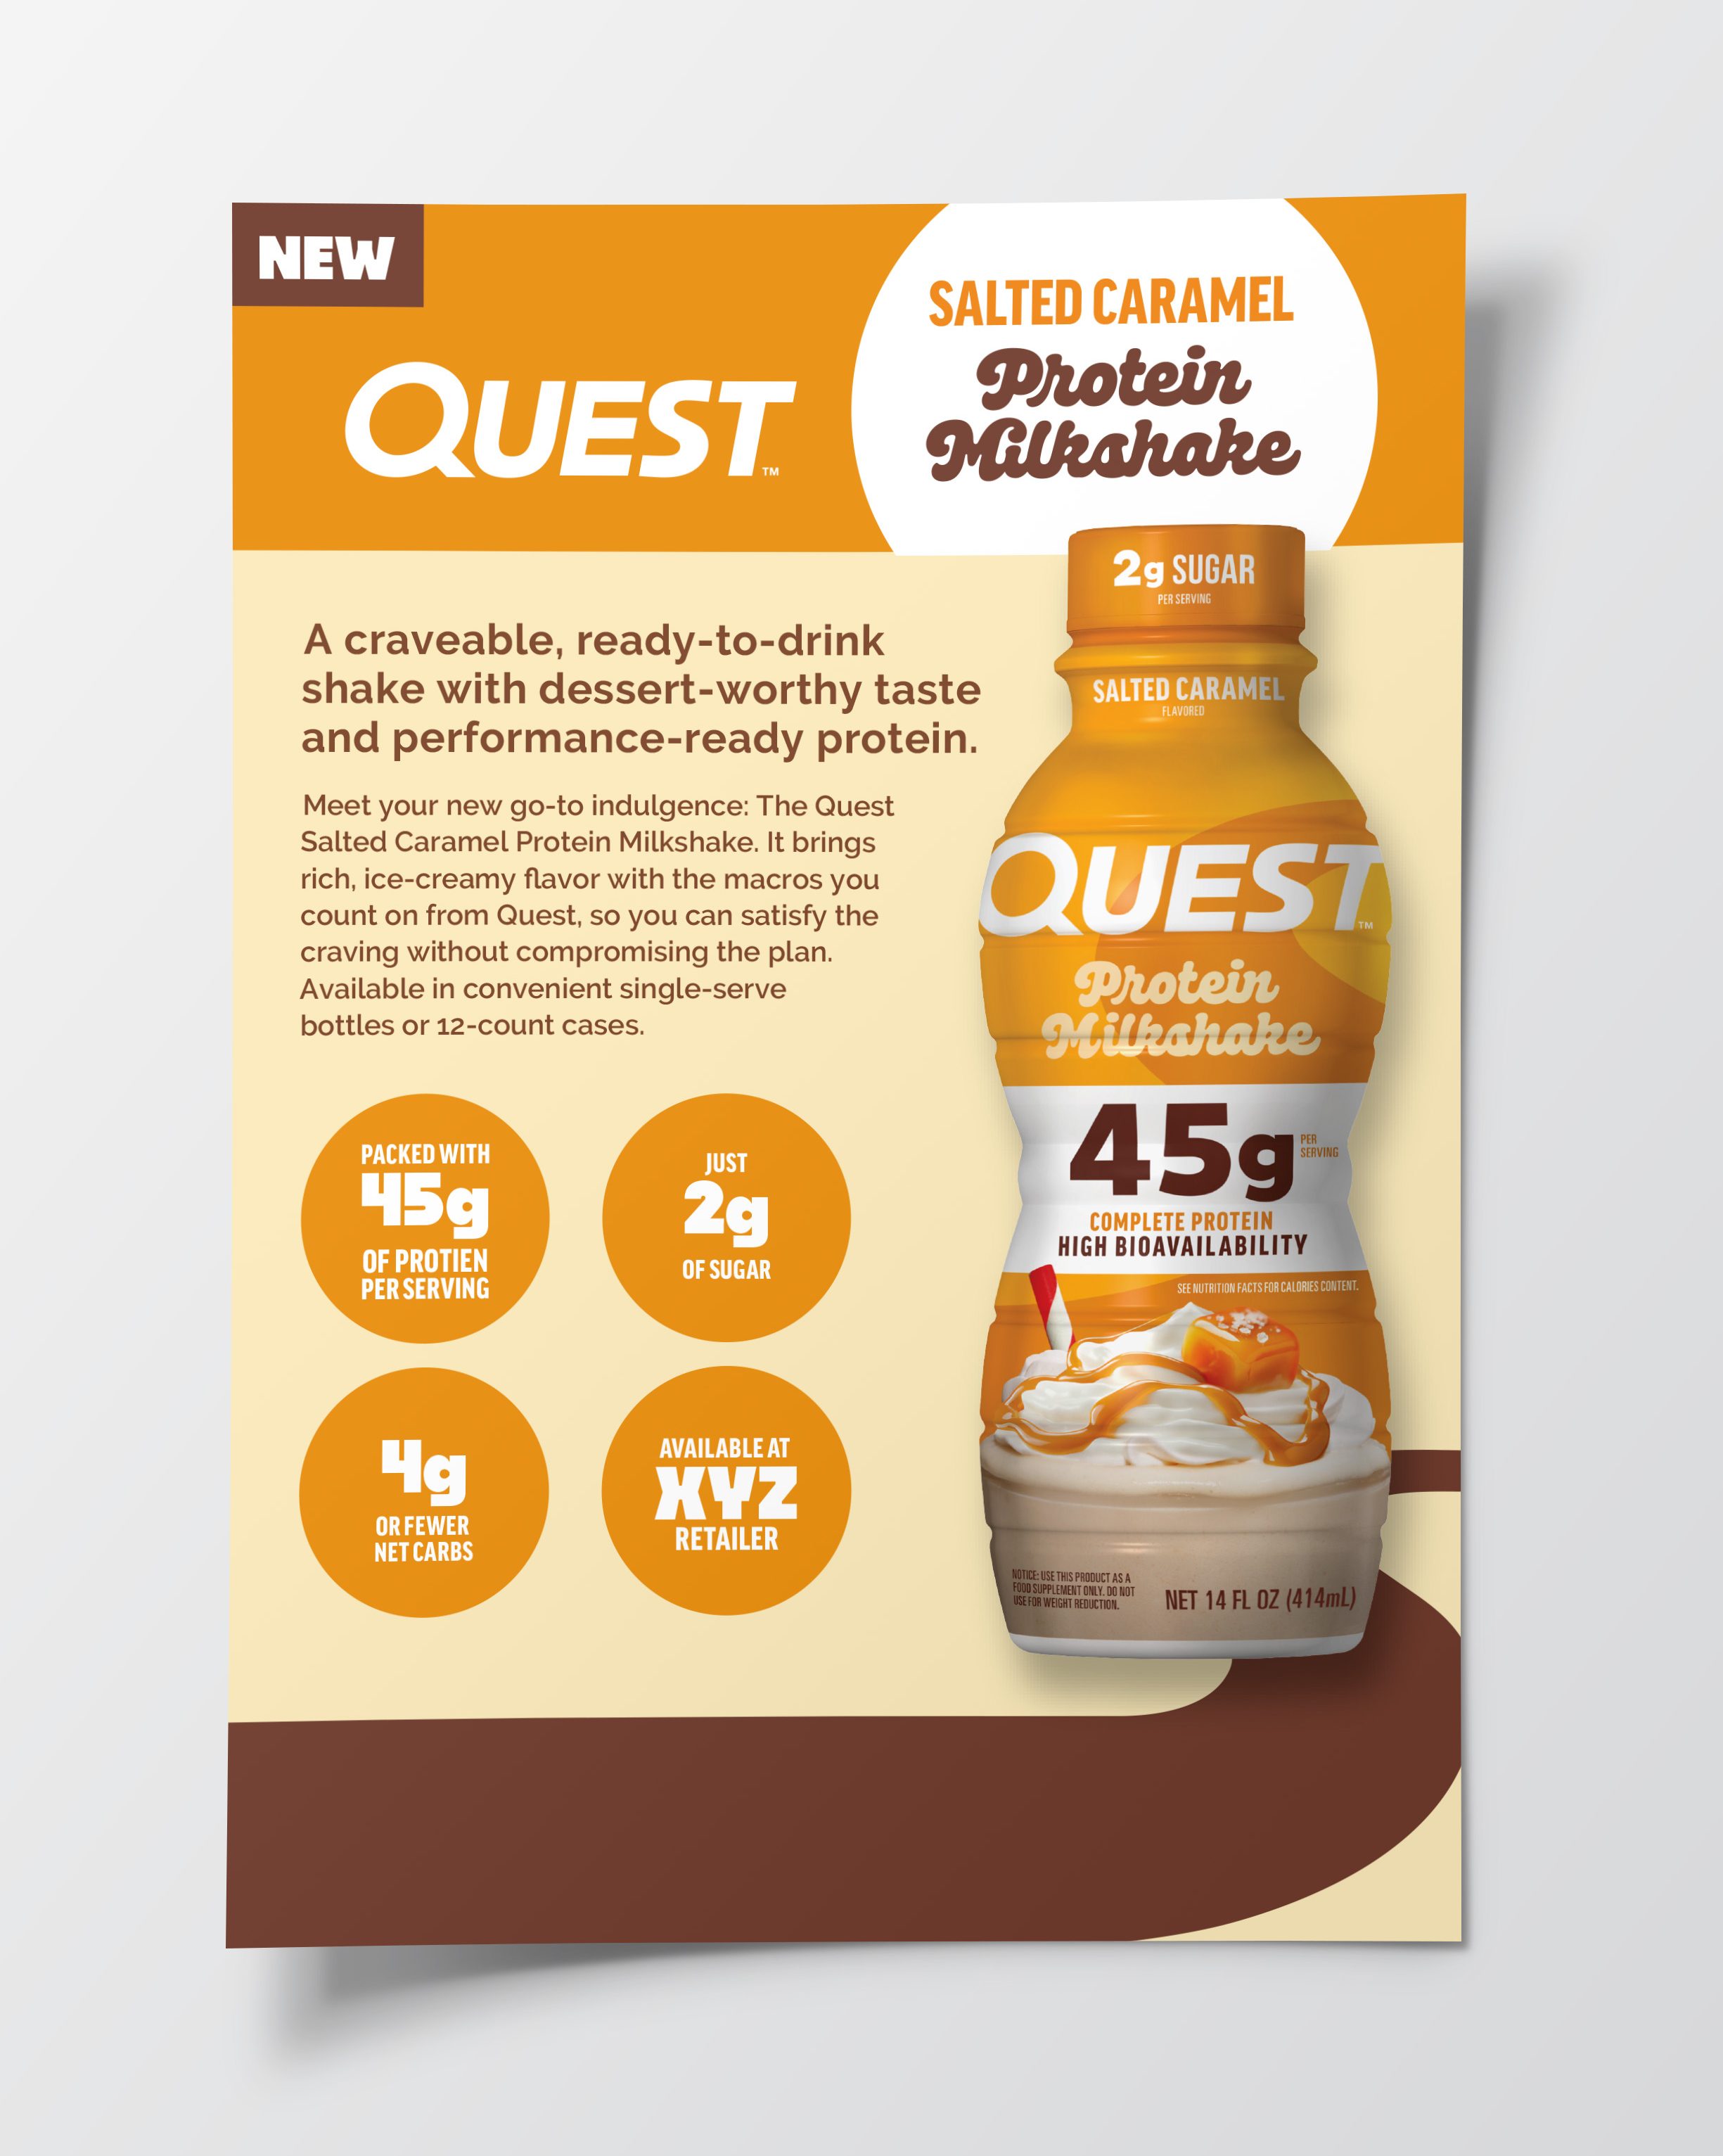
Quest PRotein
One-pagers outlining the nutritional value of different Quest protein-packed products for a client-sponsored event.
→ PRINT COLLATERAL
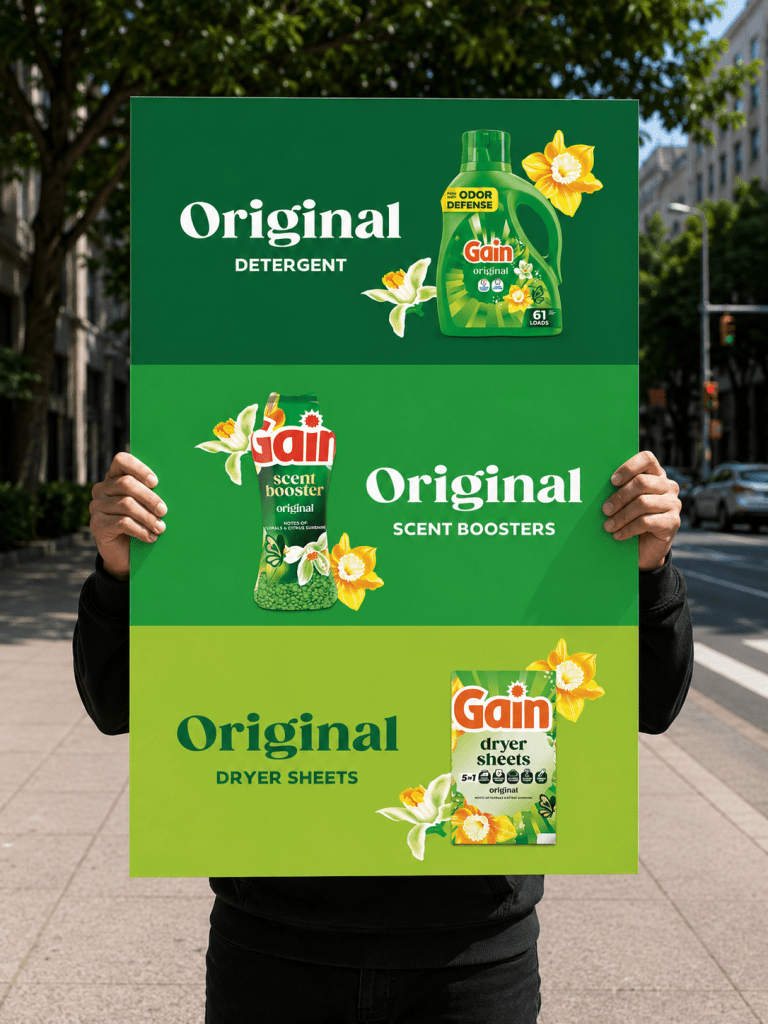
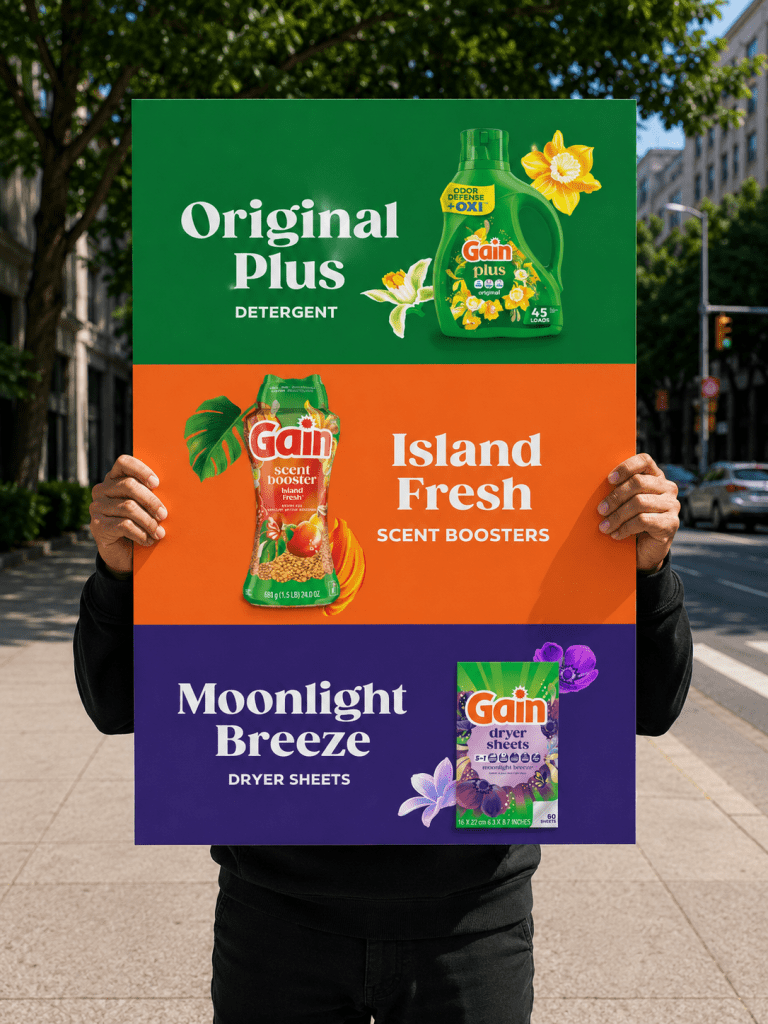
GAIN
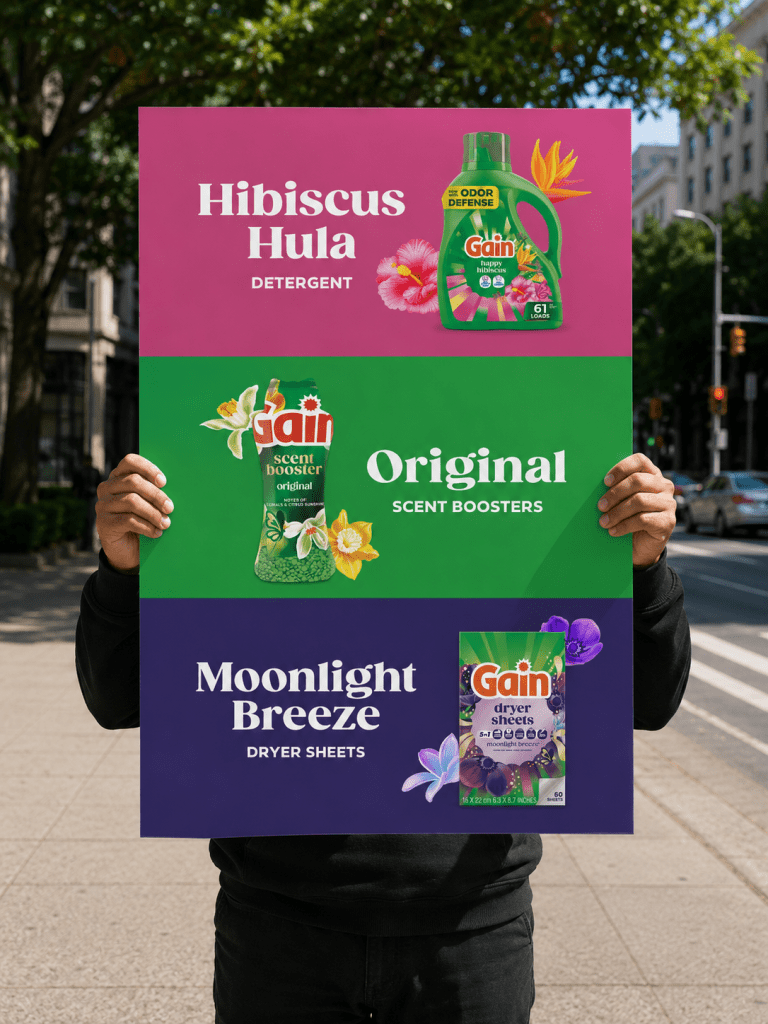
SCENT COMBOS
Foam boards used for an Instagram story, in which the host conducted street interviews so people could meet their “Scent Match”.
→ PRINT COLLATERAL
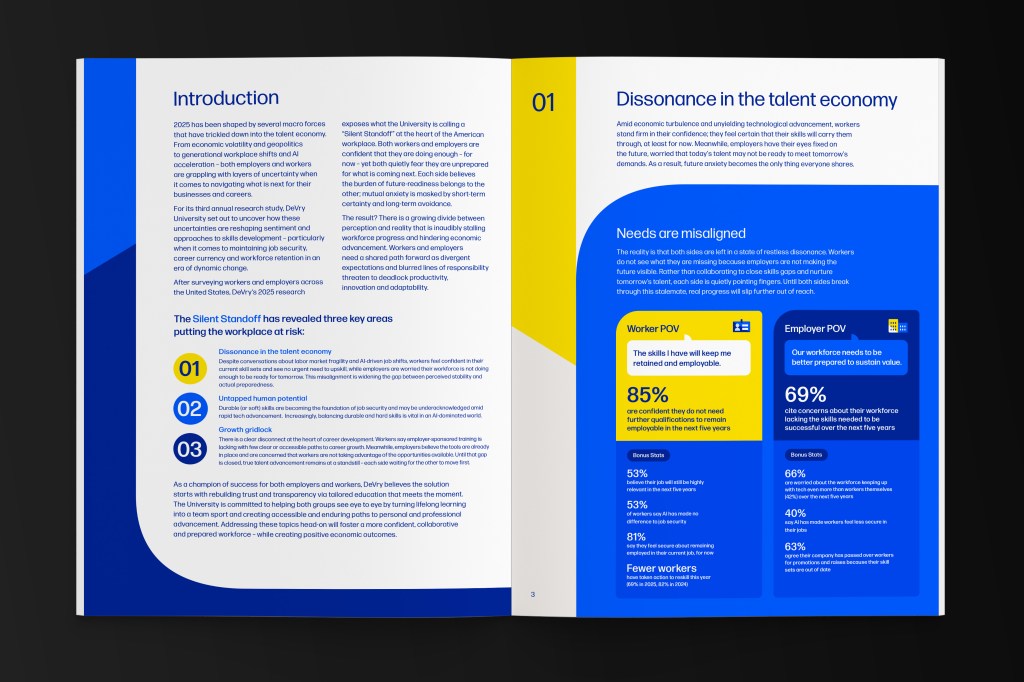
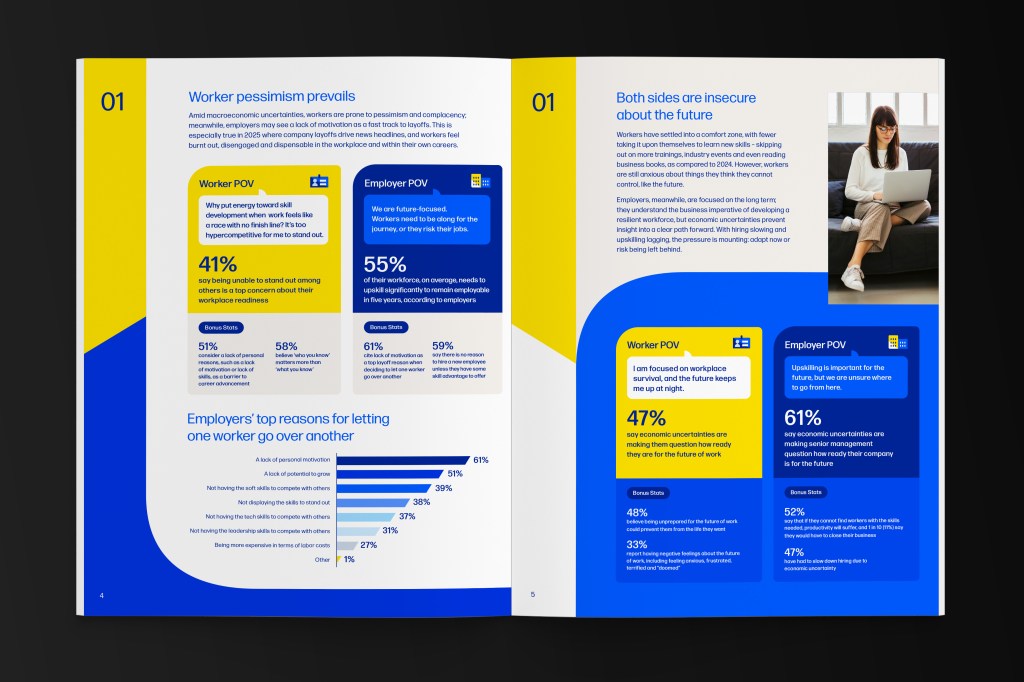
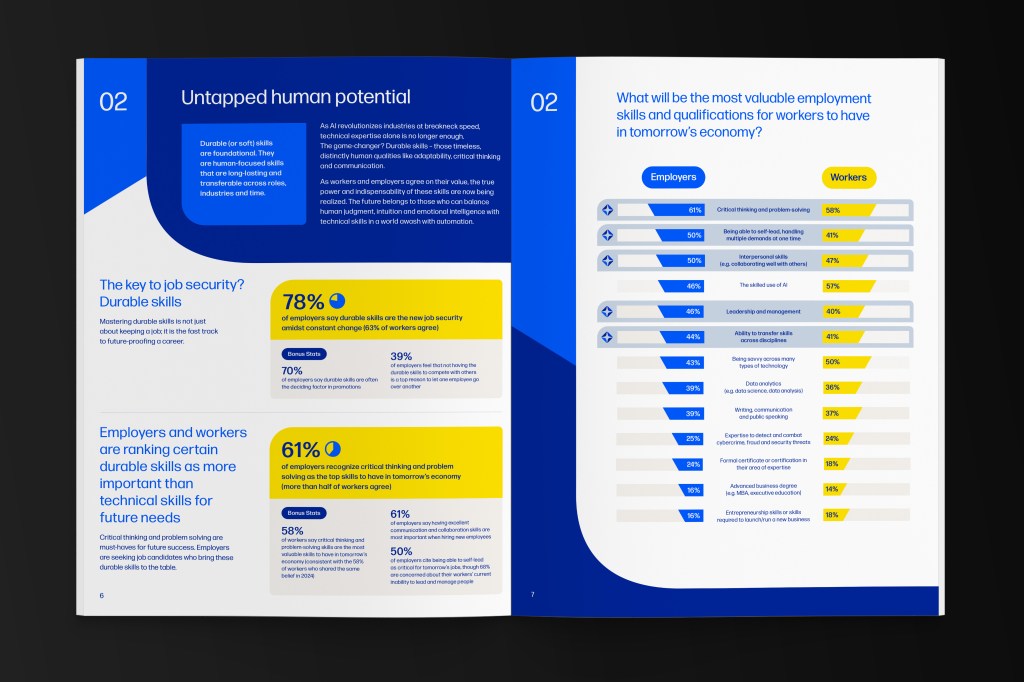
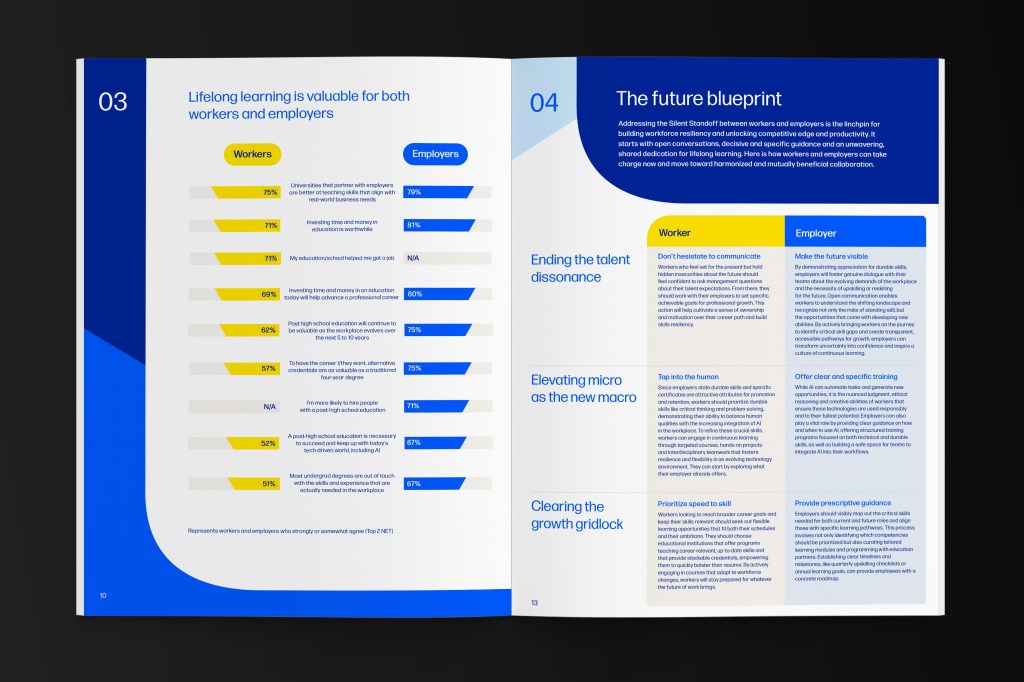
DEVRY ANNUAL UPSKILLING REPORT
DeVry University publishes an annual report reflecting on challenges in the continued education space. Each year, the report is redesigned to reflect the moment in current culture. Thoughtful layout design is necessary to balance the dense amount of content covered in the report with engaging graphics. In addition, these reports typically include data points that need to be translated into charts and data figures.
→ DATA VIS. + INFOGRAPHICS

P&G IR REPORT
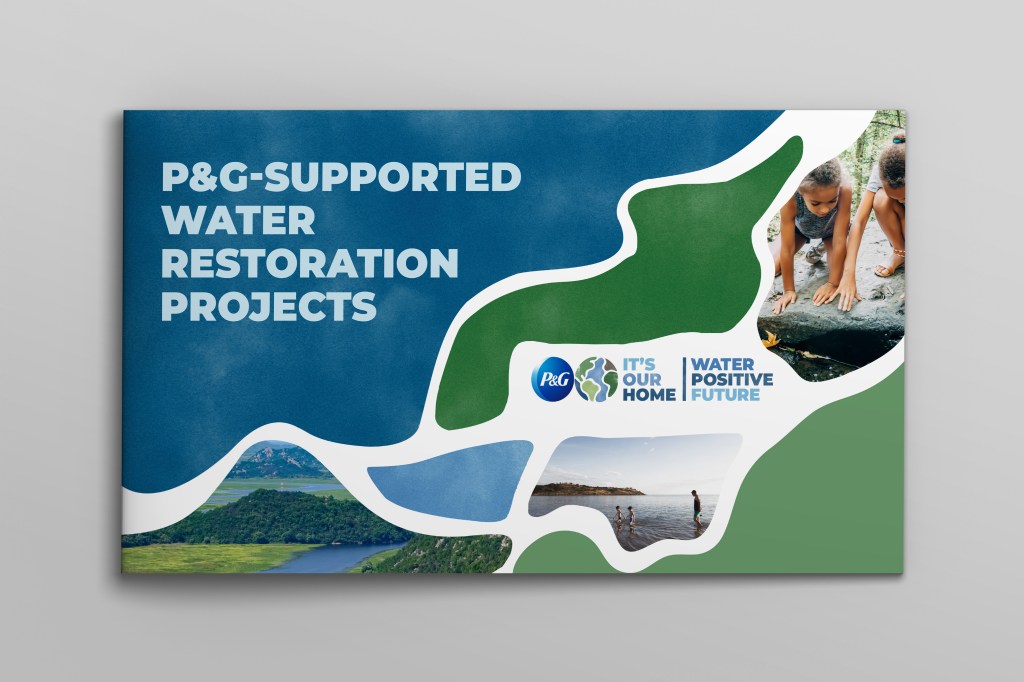
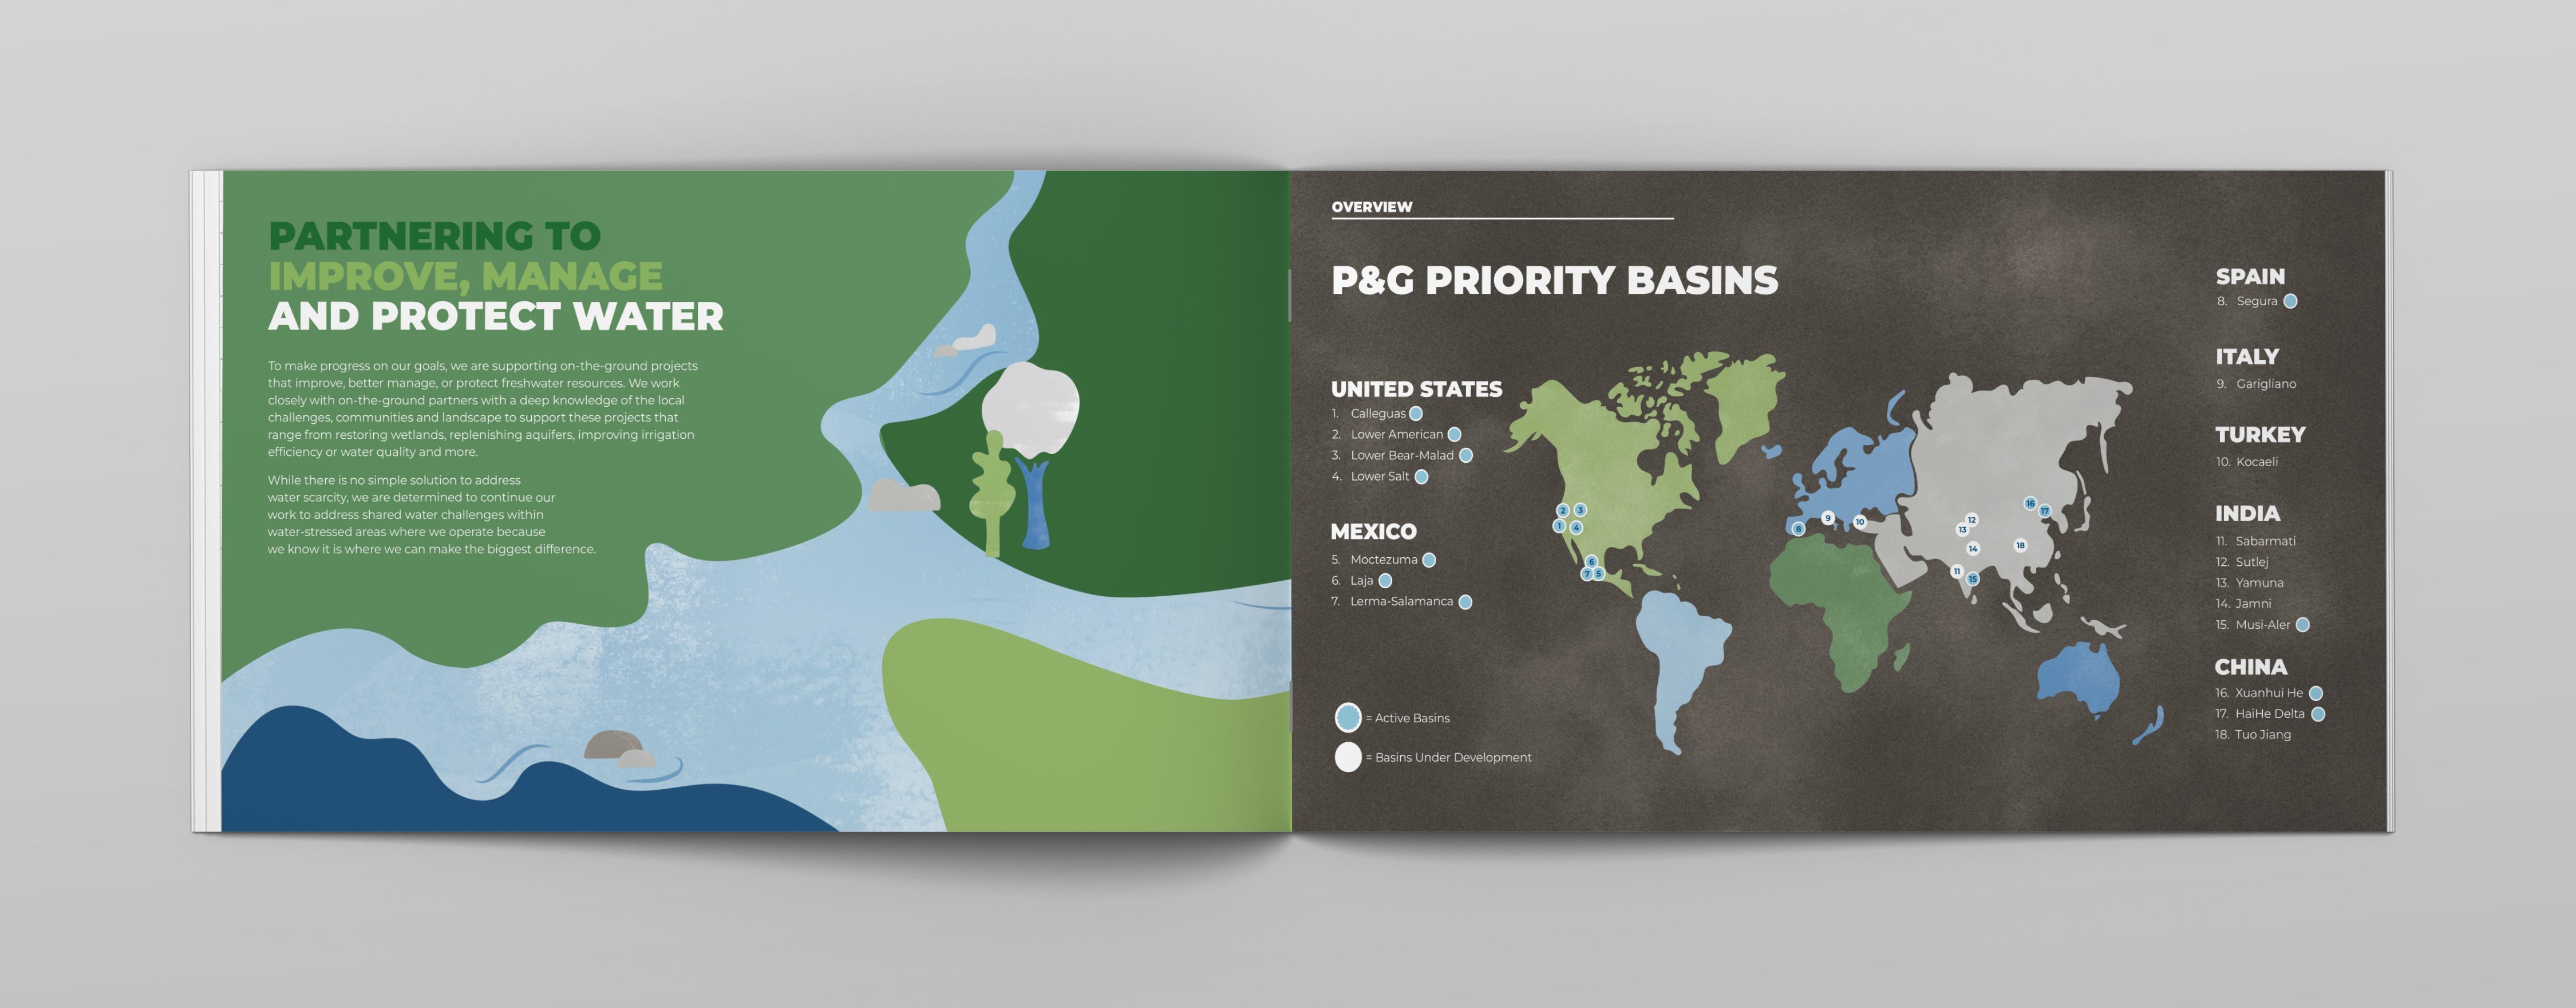
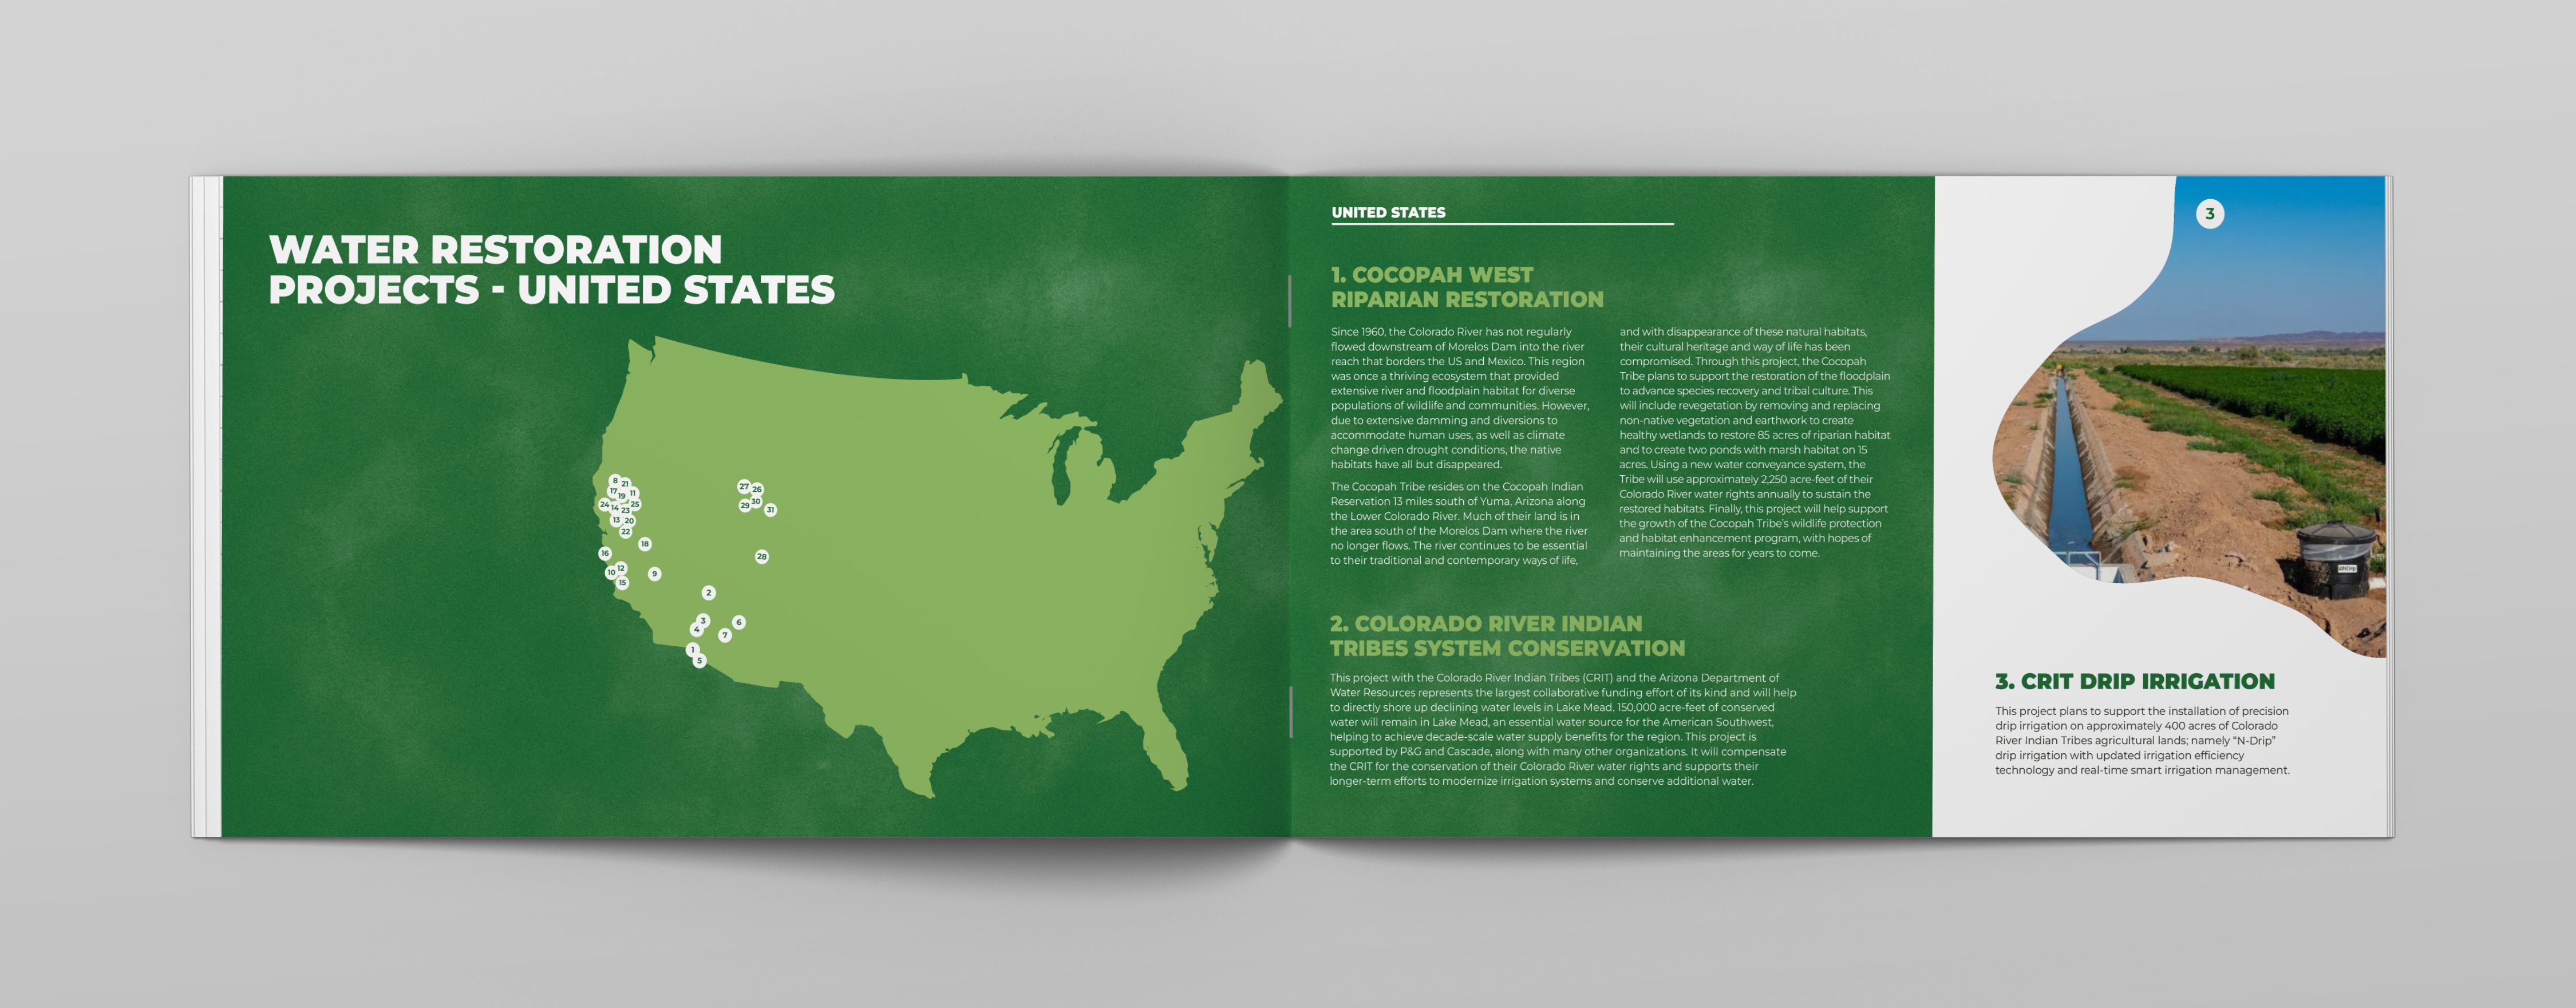
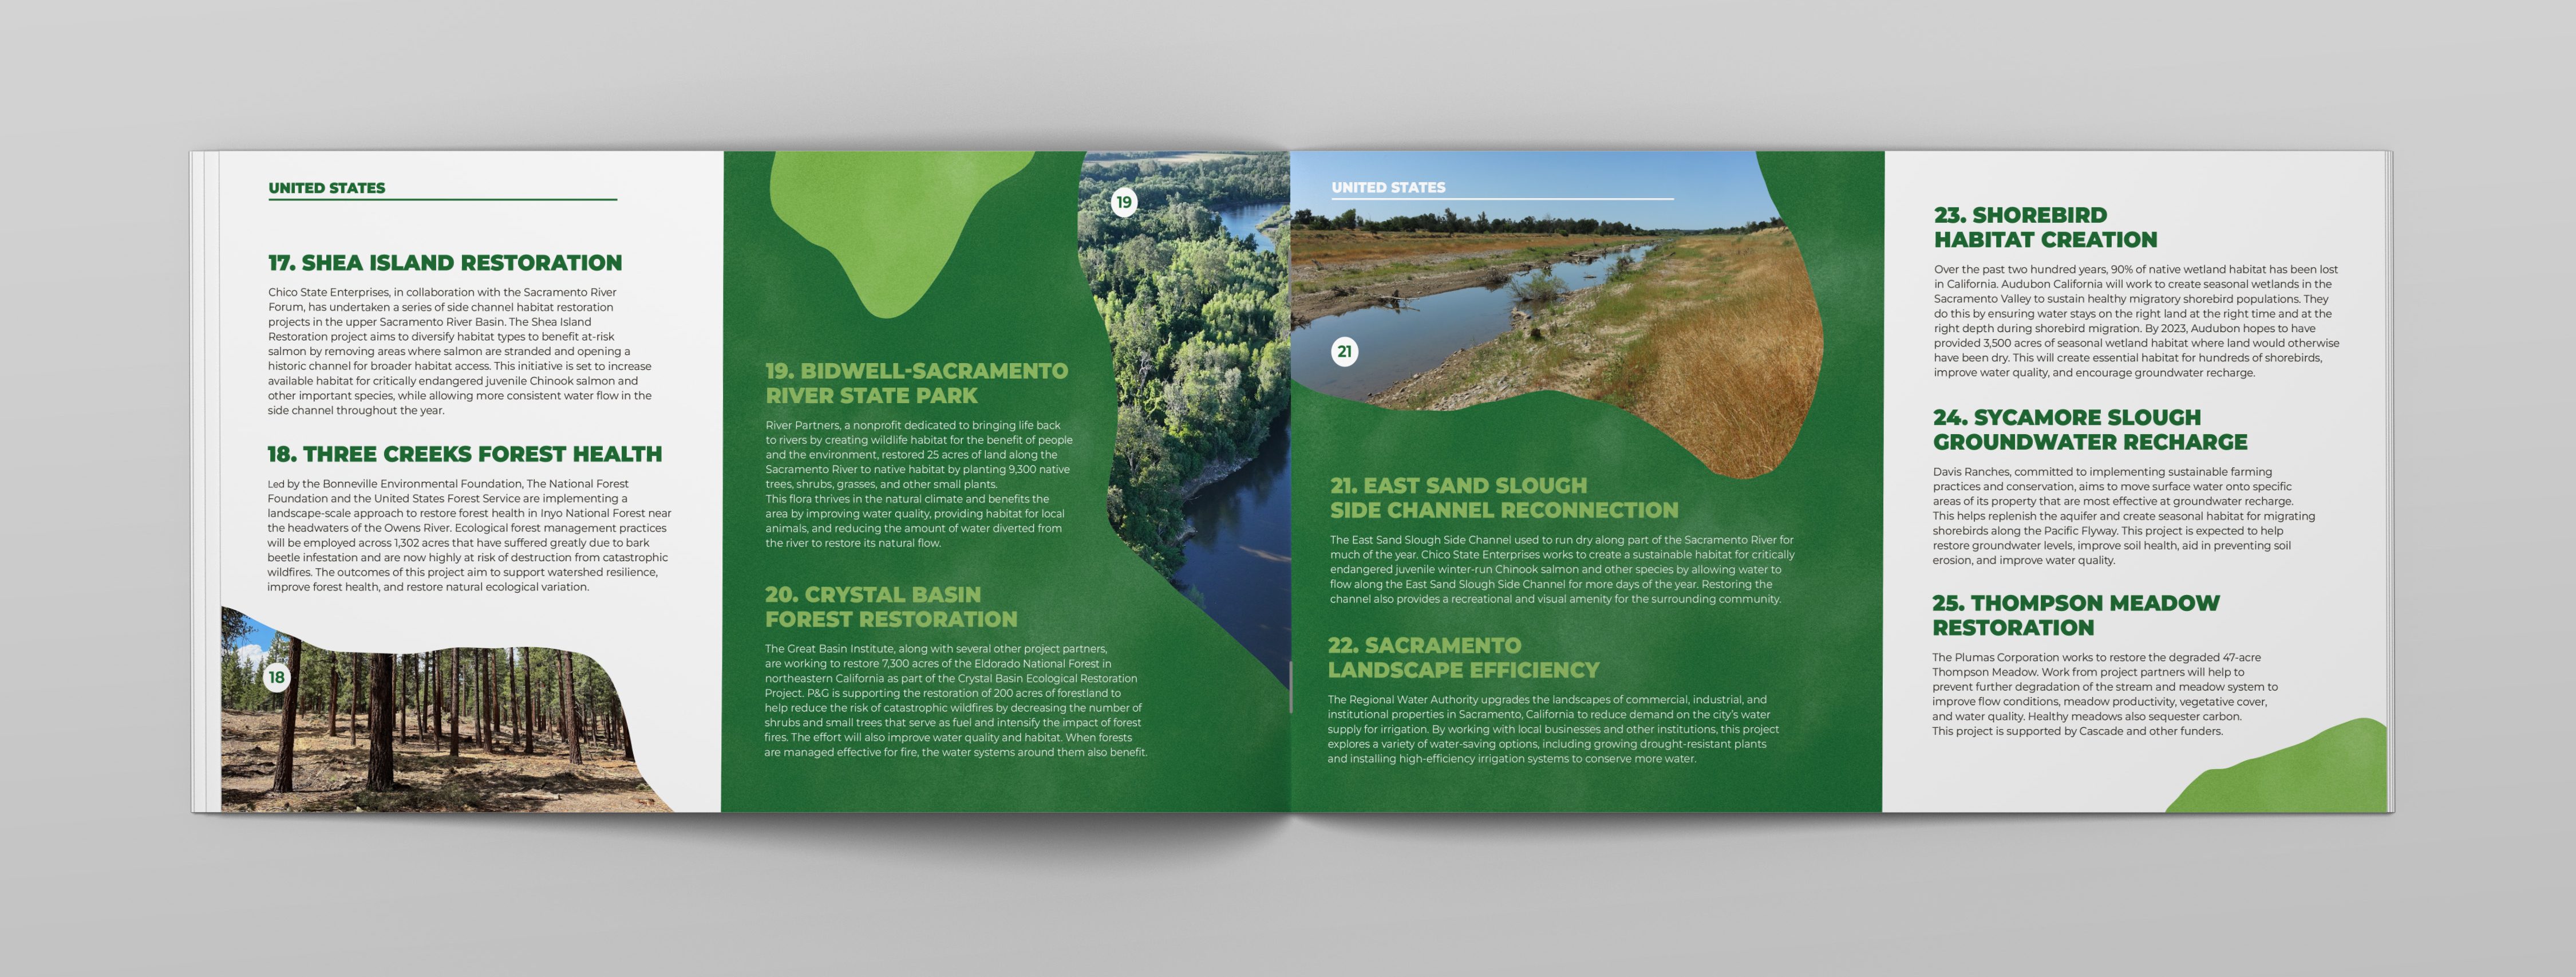
P&G’s Sustainability division published a report outlining the company’s projects that action on their commitment to global water restoration. The design leveraged the use of earth tones, natural textures, custom illustrations and water-like shapes to create a visual system that champions the organization’s efforts in a friendly way. About forty different restoration projects, broken up by country, are outlined in the report. Each section includes a reference point to the projects’ location, giving the audience a reference for just how wide-reaching the company’s impact is.
→ DATA VIS. + INFOGRAPHICS
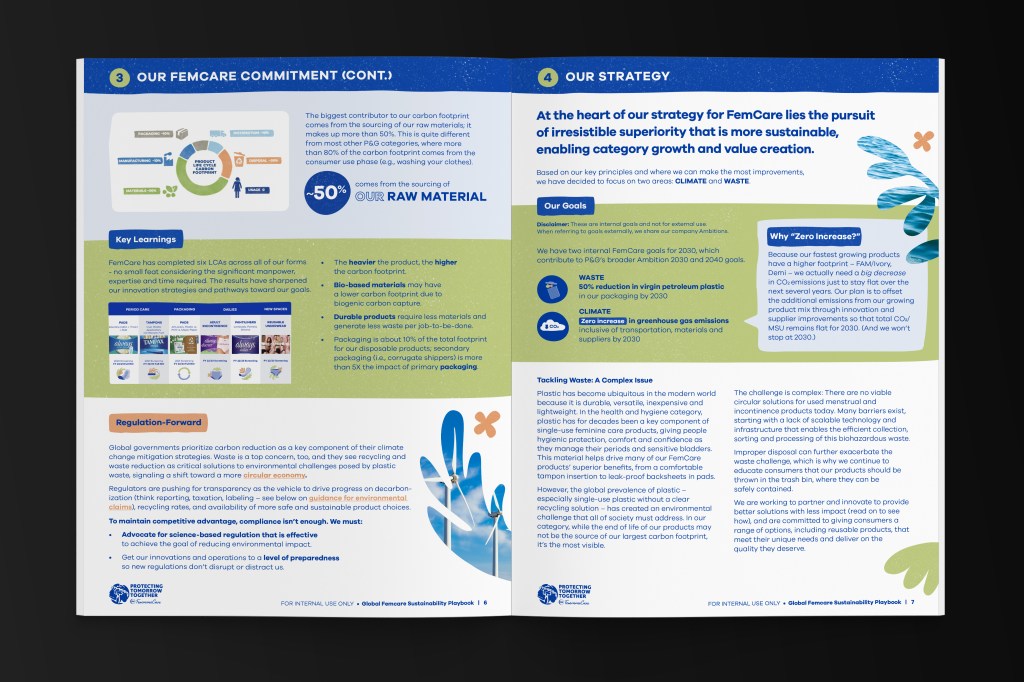
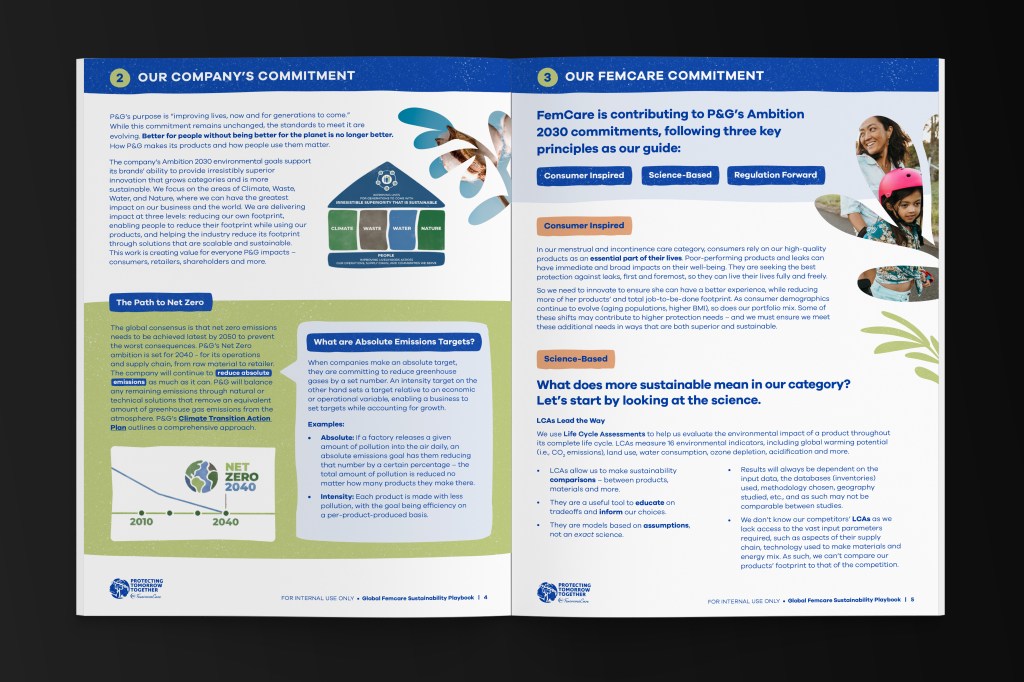
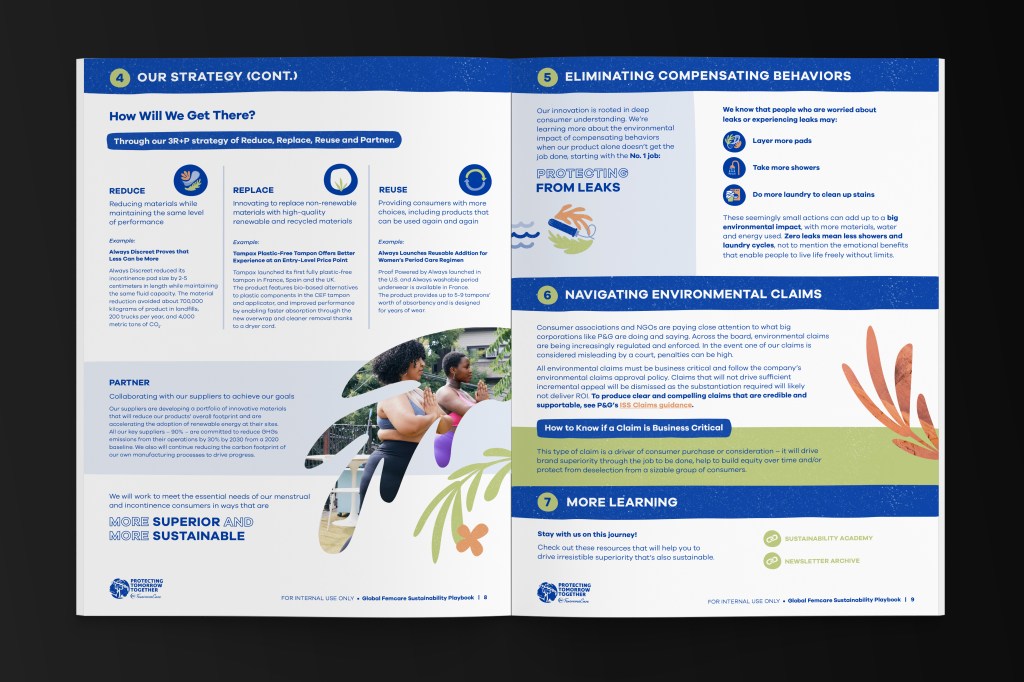
P&G GLOBAL FEMCARE PLAYBOOK
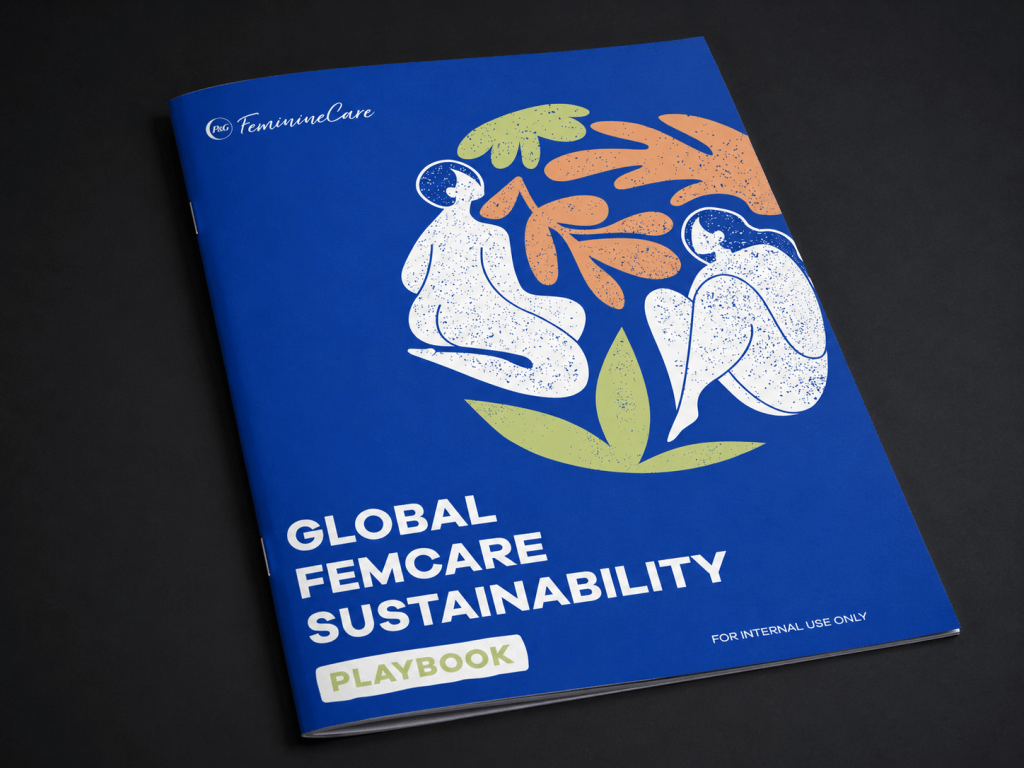
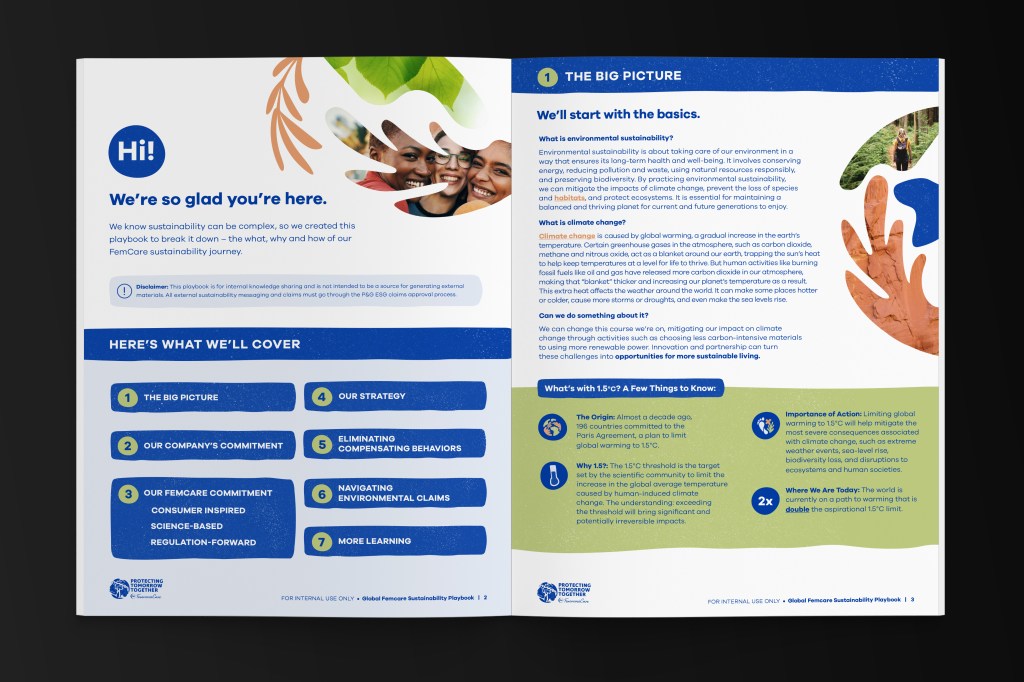
P&G’s Feminine Care sub-brand published an internal playbook outlining the company’s commitment to environmentalism. It detailed the brand’s sustainability practices, strategies, goals, and environmental claims. To bring the spirit of FeminineCare’s vision to life playful illustrations and organic shapes and female-forward imagery were used across the report. The end result was an approachable, feminine design that made the report easy to read apply across the organization.
→ DATA VIS. + INFOGRAPHICS
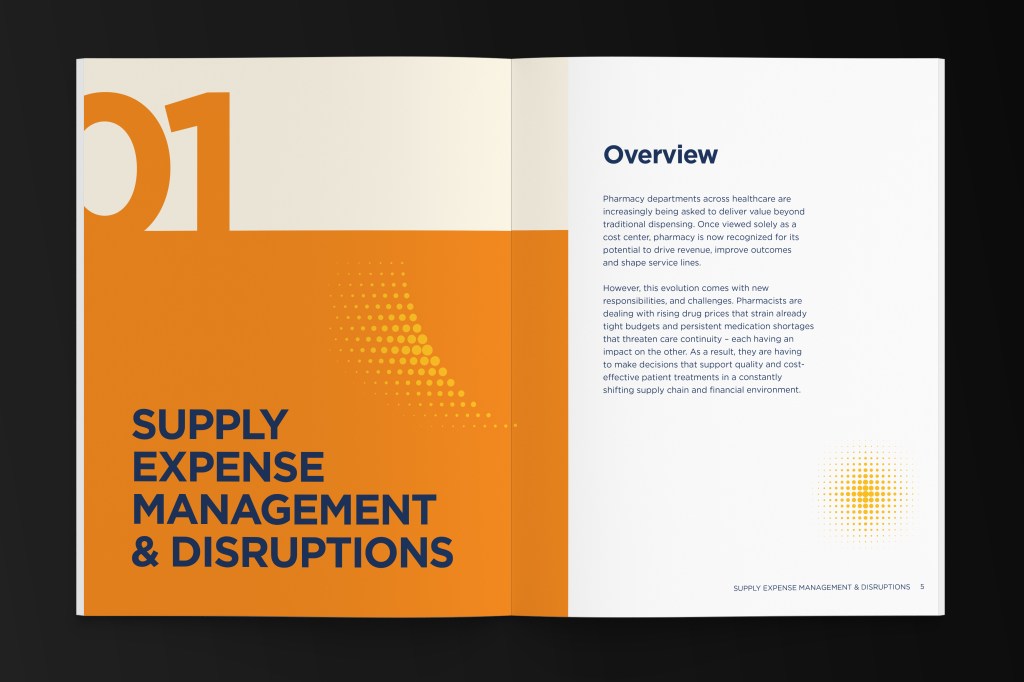
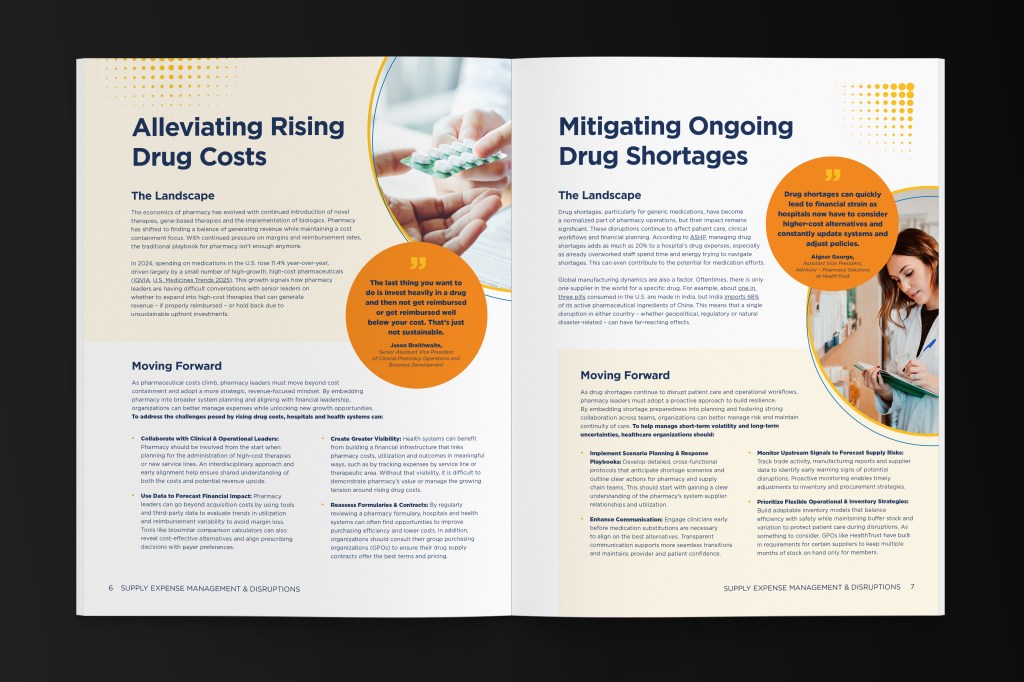
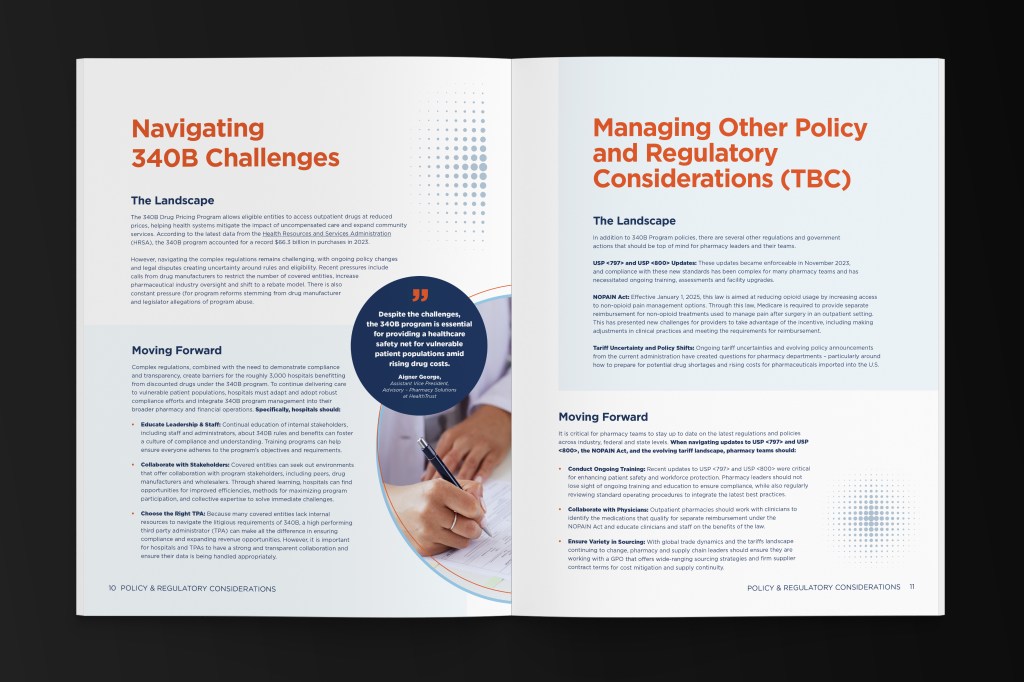
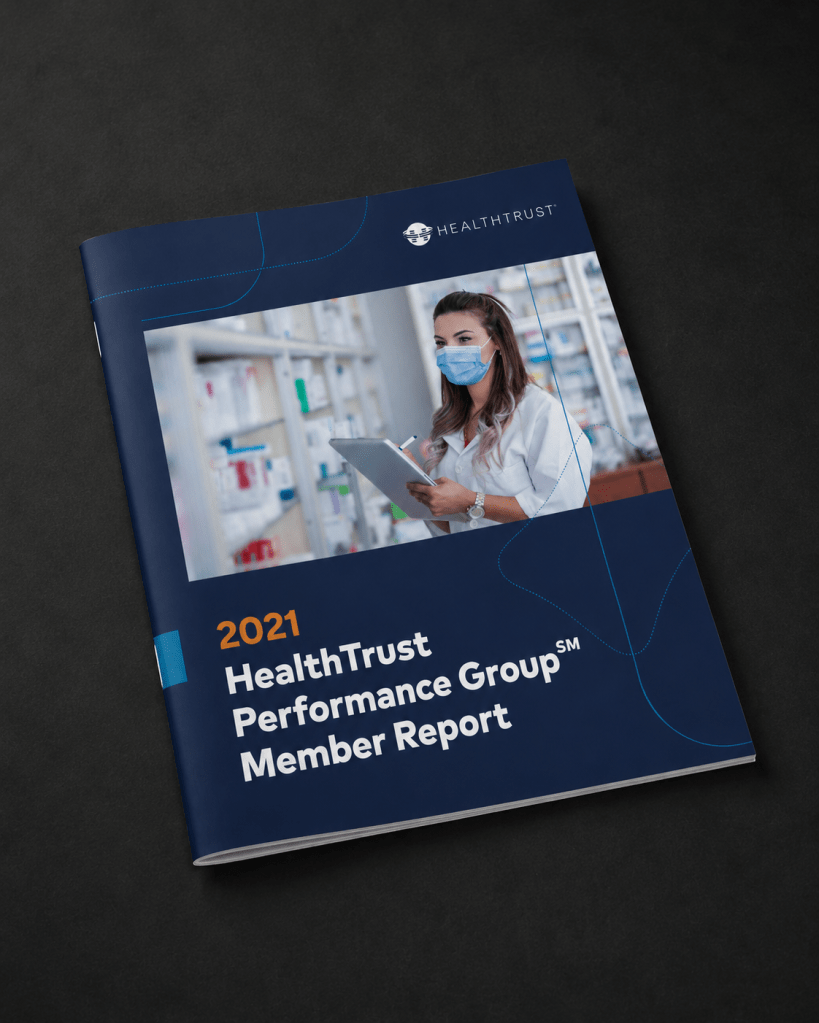
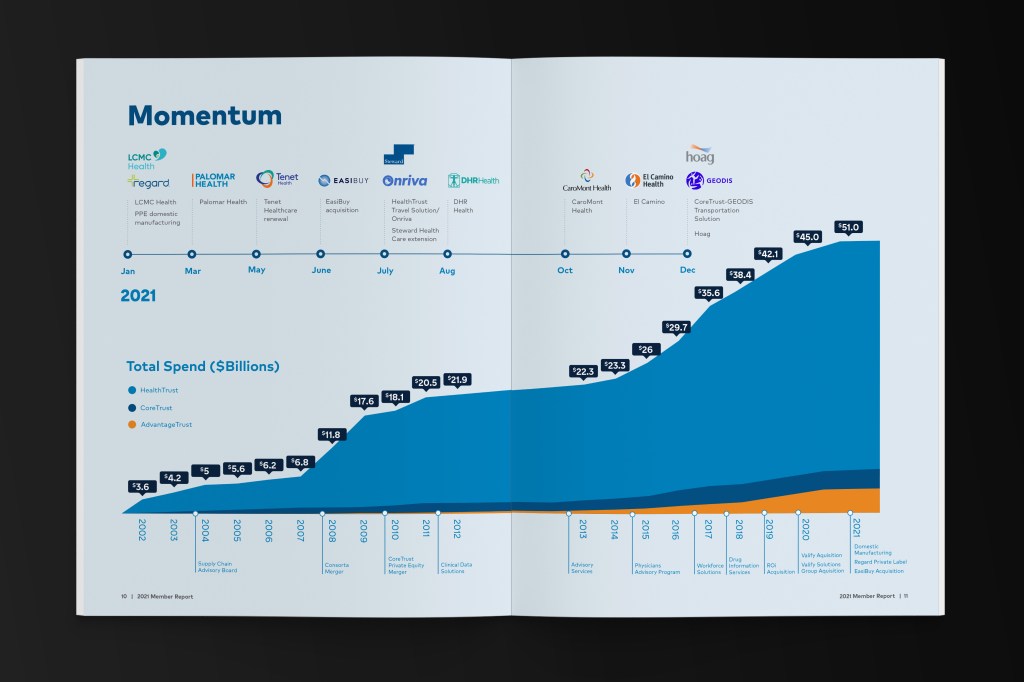
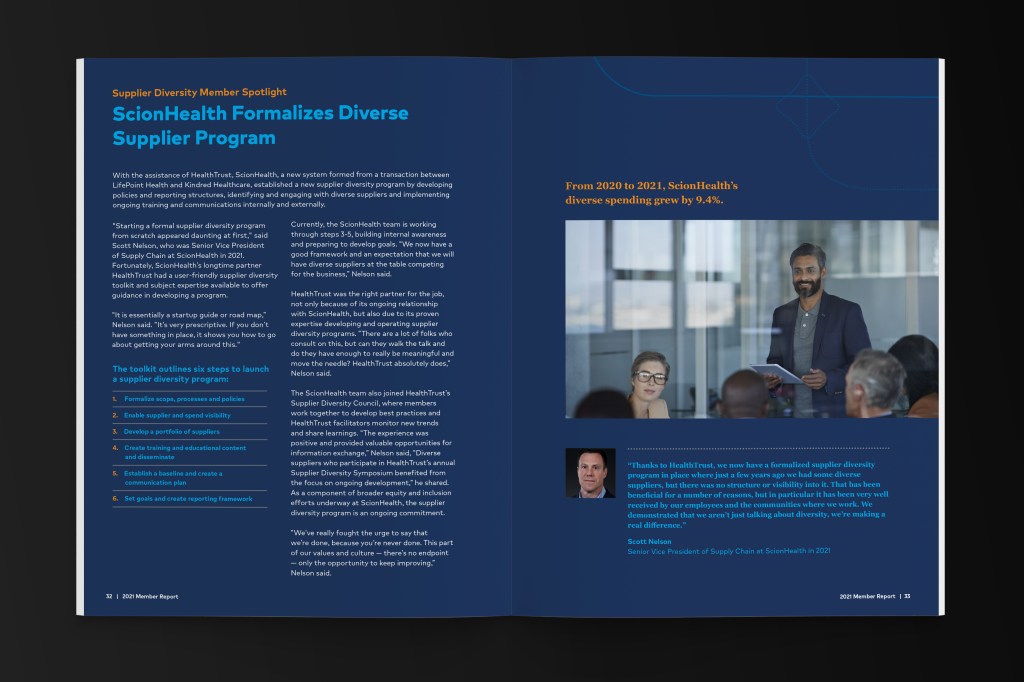
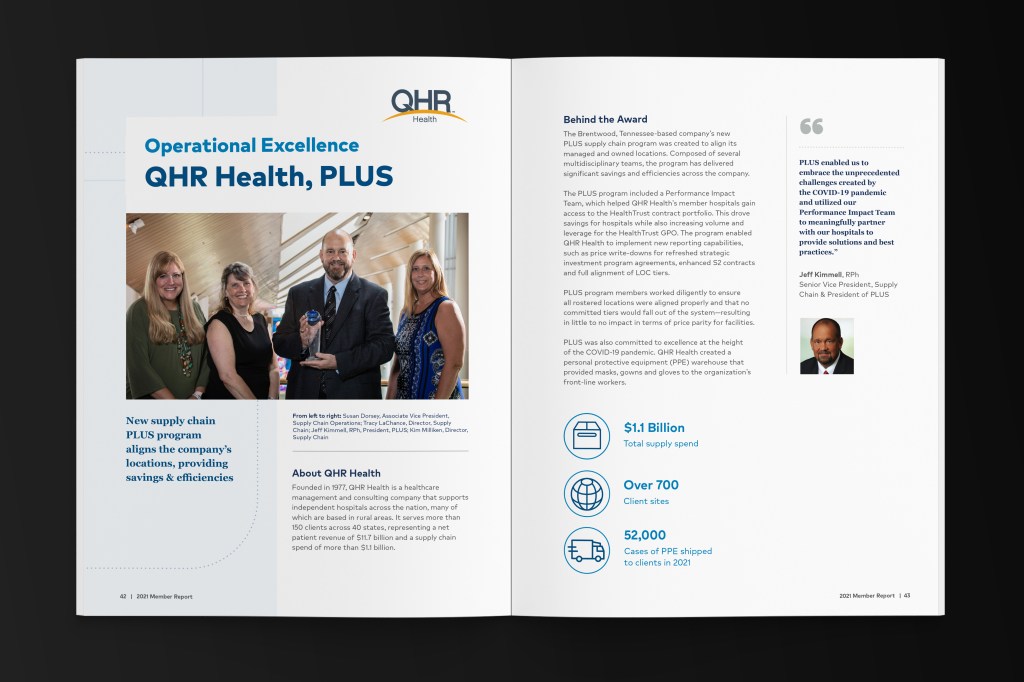
HEALTHTRUST annual pharmacy 360 report
HealthTrust publishes a pharmacy report reflecting on challenges in the healthcare industry annually. Each year, the report is redesigned to reflect the company’s resilience, their response and establish a distinct creative take for the year in review. Thoughtful layout design is necessary to balance the dense amount of content covered in the report with engaging graphics. In addition, these reports typically include complex data points that need to be translated into charts and data models.
→ DATA VIS. + INFOGRAPHICS